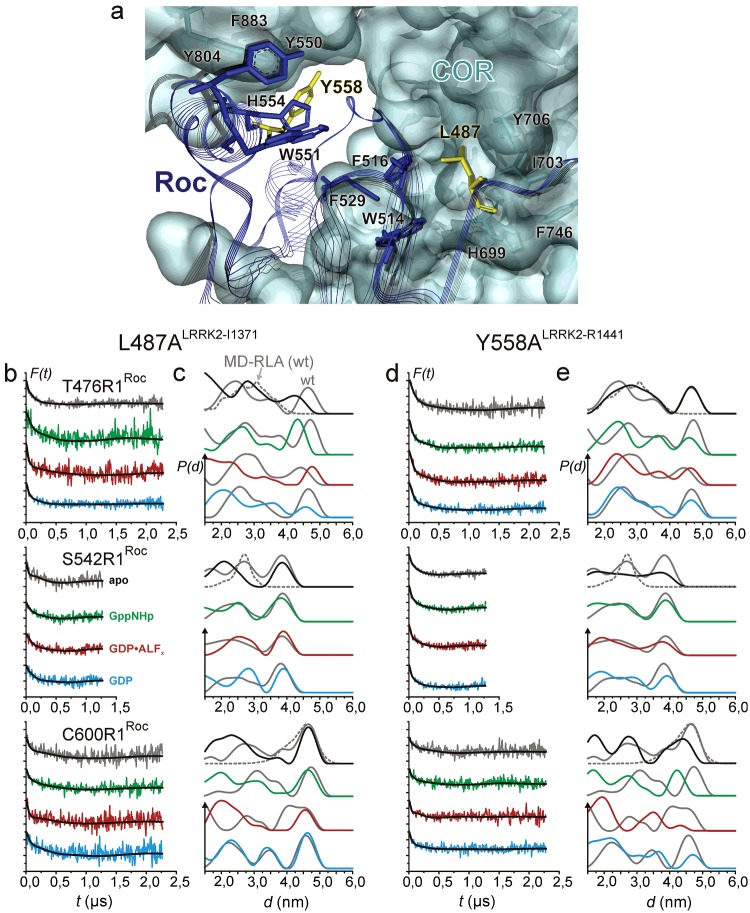
Figure 4. Influence of mutations in the Roc/COR interface on nt-dependent interprotomer distances in CtRocCOR.
(a) Atomic model showing the hydrophobic Roc-A/COR-A interface region. Residues and the transparent surface of COR-A are coloured in cyan. Roc-A residues and line ribbons are shown in blue. Residues Leu487 and Tyr558 (both in Roc-A) are coloured in yellow. (b–e) DEER data recorded at X band (9.3–9.4 GHz) for additional mutations (b and c) L487A (Ile1371 in LRRK2) and (d and e) Y558A (Arg1441 in LRRK2). (a and c) Background-corrected dipolar evolution data F(t). Major tick marks are separated by 0.2. (b and d) Distance distributions obtained by Tikhonov regularization (solid lines). Grey distance distributions are for the respective spin-label mutants without additional mutations (Figure 2 c) and for the MD-RLA (dotted distributions) of the dimer model shown in Figure 1(b).

