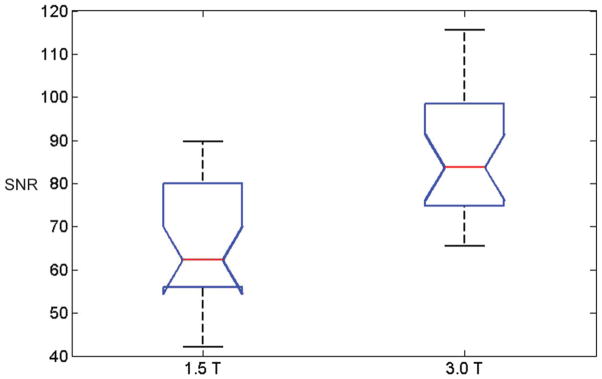
Figure 4.
Box-and-whisker plot of the SNRs of the reference regions in 53 patients imaged at 1.5T and 53 patients imaged at 3.0T. The red line indicates the median, the whiskers indicate the range, and the box indicates the 25th and 75th percentiles. Comparison intervals are drawn using notches. The interval endpoints are the extremes of the notches or the centers of the triangular markers.

