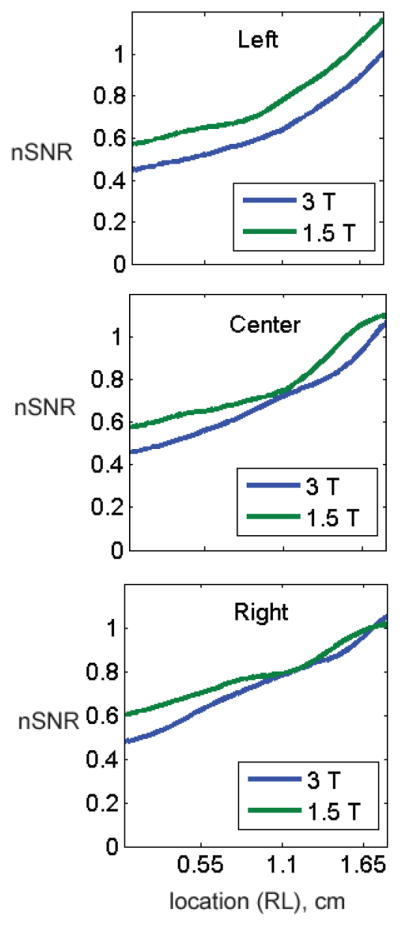
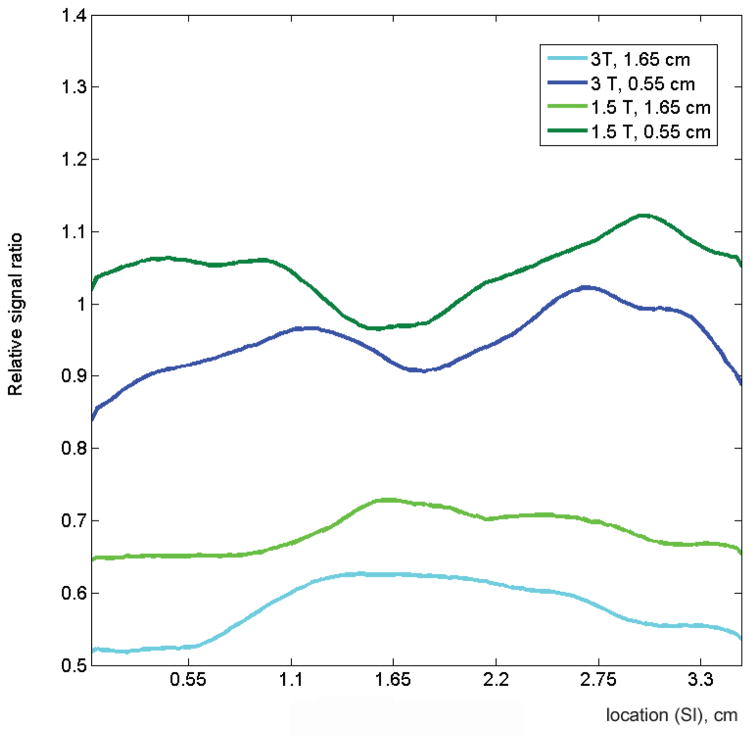
Figure 5.

(A) Mesh surface displays of the average normalized SNRs (nSNRs) of all patients for each field strength derived from b=0 images. Both displays demonstrate a drop in nSNR as a function of distance from the coil, with a rapid drop in SNR towards the anterior portion and edges of the prostate. Average nSNR profiles in (B) three horizontal (right-to-left, RL) planes located in the left, center and right planes and (C) two vertical (superior-inferior, SI) planes located at distances of 0.55 cm and 1.65 cm from the bottom of the coil are show. Overall, the normalized profiles are similar for the two field strengths in both the RL and SI planes. However, the normalized profile of 3.0T images is consistently lower than that of 1.5T images.


