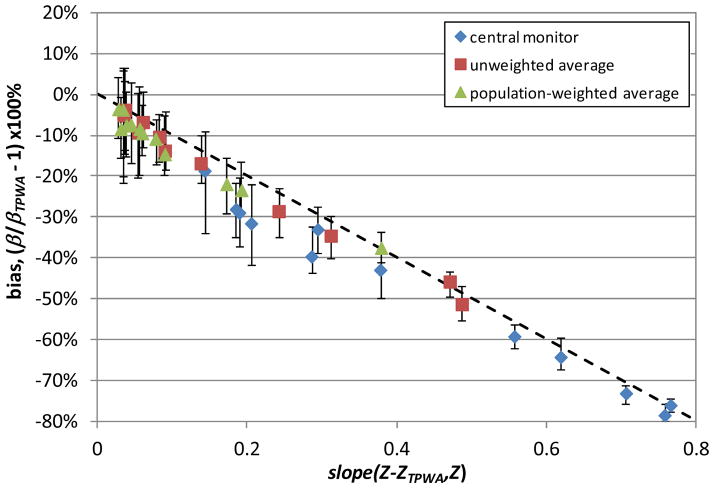
Figure 2. Observed bias (median, 82% interval) in the RR per unit increase in concentration for the three metrics relative to the RR estimated using true population-weighted average (TPWA).
The x-axis is the slope of the relationship between the error (Z-ZTPWA) and the measurement (Z). Bias is presented on the y-axis. Data points represent each of the 12 pollutants (unlabeled) for each of the three metrics. A 1:1 line is shown for reference.

