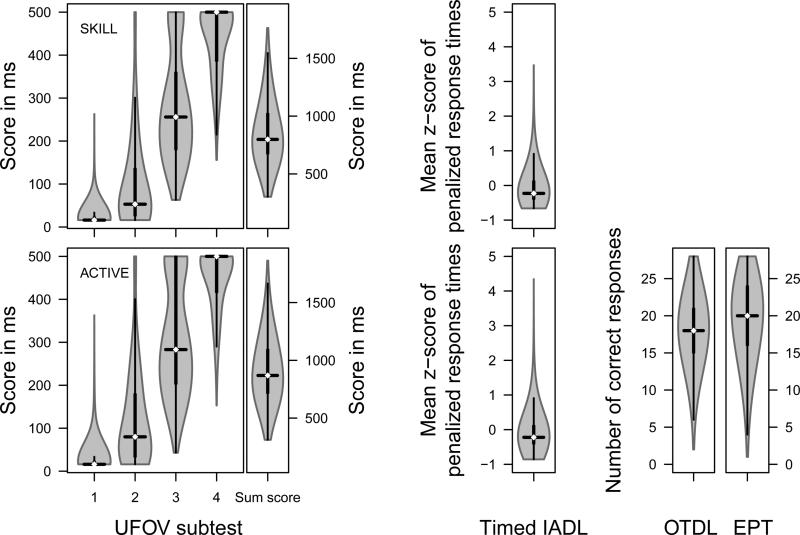
Figure 2.
Violinplots of measures in the SKILL (top row) and ACTIVE studies (bottom row). UFOV scores are the display presentation time at which test takers achieves an accuracy of 75%. Timed IADL scores are the mean of z-standardized response times on all five tasks penalized for errors. The black lines represent Tukey boxplots giving median, interquartile range (IQR), and most extreme values within 1.5 IQR of the upper and lower quartile. Grey planes represent kernel densities of each distribution. UFOV = Useful Field of View; Timed IADL = Timed Instrumental Activities of Daily Living; OTDL = Observed Tasks of Daily Living; EPT = Everyday Problems Test.

