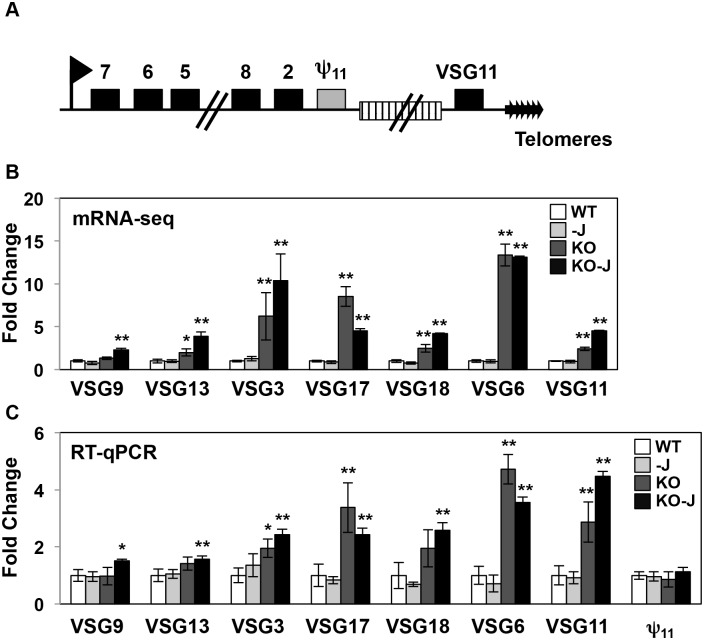
Fig 6. H3.V regulates VSG gene expression from silent telomeric bloodstream expression sites.
(A) A schematic diagram of the silent ES15 (not to scale). The box with stripes represents the 70 bp repeats. Numbers indicate ESAG genes. Grey box represents the VSG pseudogene 11 (Tb427.BES126.13). (B-C) mRNA-seq and RT-qPCR analysis of the indicated VSG genes in silent expression sites. As described in Figs 3D and 5E, white bars: Wild type; grey bars: Wild type+DMOG; dark grey bars: H3.V KO; black bars: H3.V KO+DMOG. For mRNA-seq analysis, p values determined by Cuffdiff are indicated by asterisks: *, p value ≤ 0.05; **, p value ≤ 0.01. For RT-qPCR analysis, p values were calculated using Student’s t test. *, p value ≤ 0.05; **, p value ≤ 0.01.

