
Fig 4. Exemplar time series when correlation is high.
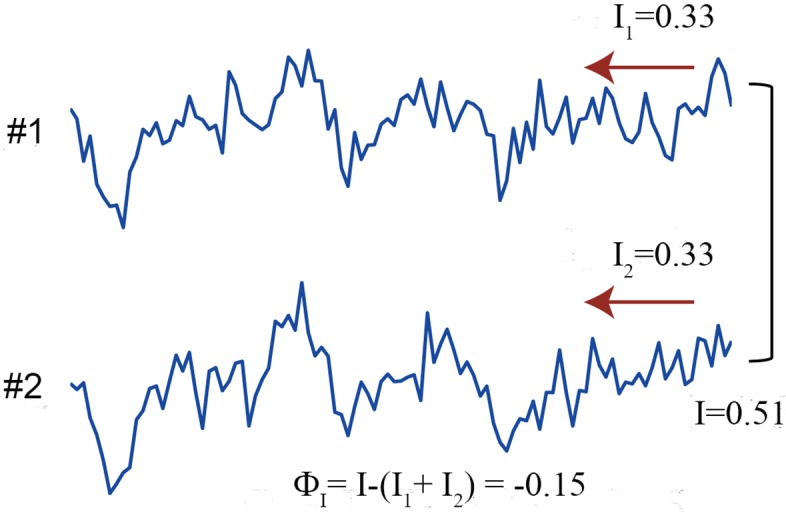
The strength of noise correlation c and the connection strength a are set to both 0.4 in the linear regression model (Eq 13). I 1 and I 2 represent the mutual information in unit 1 and 2, and I represents the mutual information in the whole system. In this case, the sum of the mutual information in the parts exceeds the mutual information in the whole system and ΦI is negative.