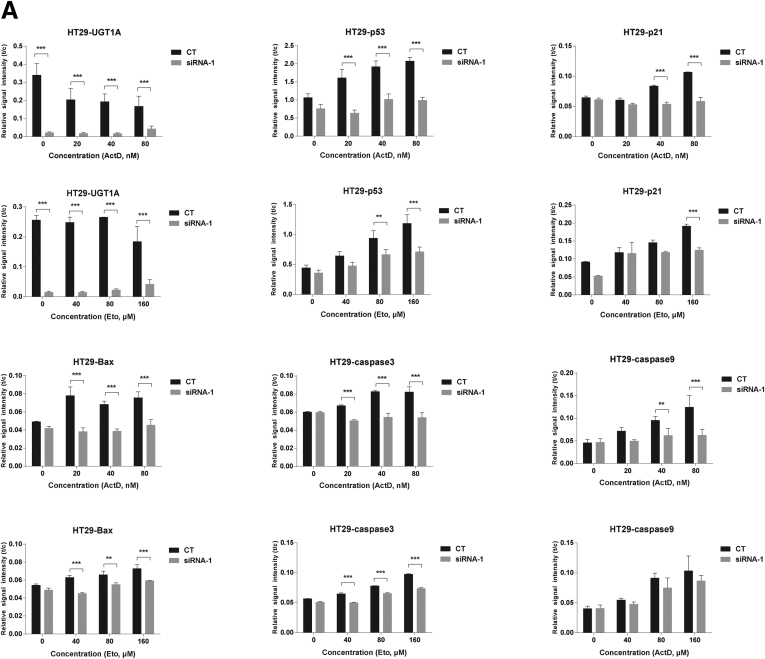
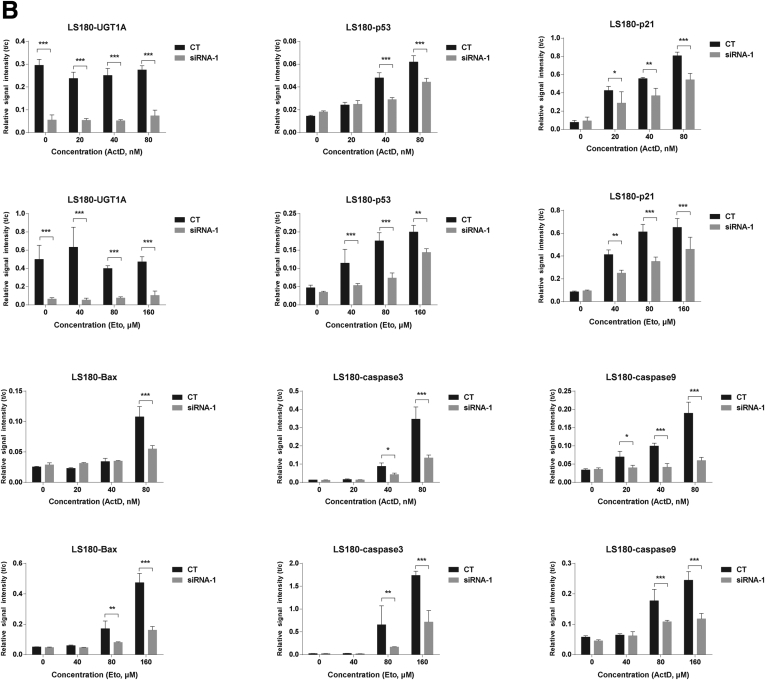
Supplementary Figure 1.
Quantitation of Western blots after UGT1A silencing in LS180 and HT29 colon epithelial cells. Western blots from actinomycin D and etoposide treated cells from LS180 (Figure 1B) and HT29 (Figure 1C) cells were quantitated using imaging software from the BioRad ChemiDoc Touch Imaging System and plotted as Relative Signal Intensity or t/c (target protein/internal reference protein-GAPDH). Statistically significant differences in inducible p53 expression along with p21, Bax, caspase 3 and caspase 9 expressions were demonstrated after knockdown of the Ugt1a locus in these cells.


