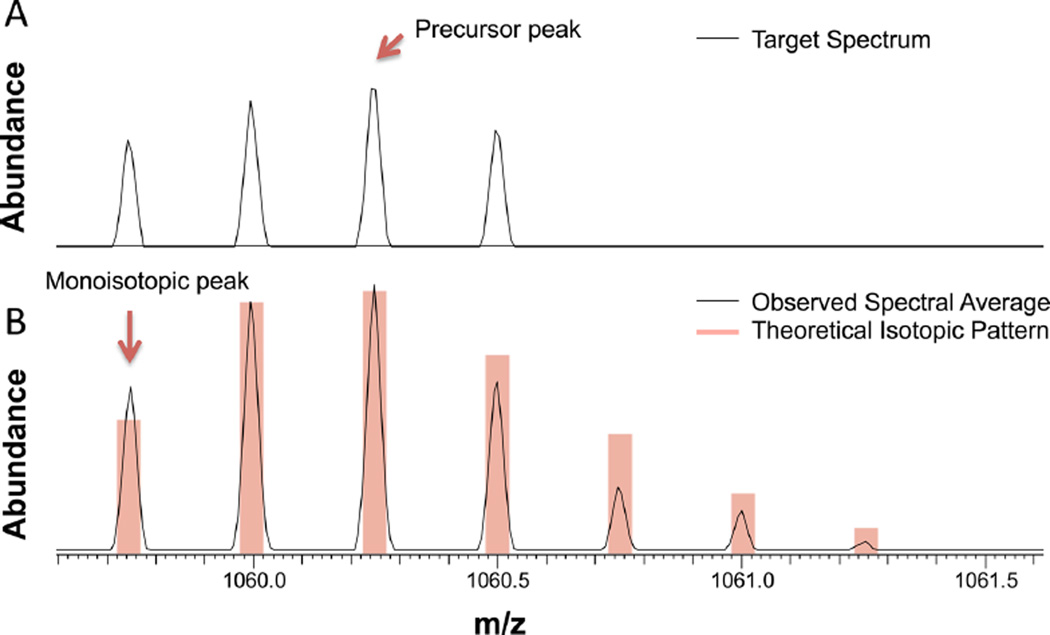
Figure 4.
Detection of the glycopeptide monoisotopic peak. (A) Isotopic pattern of a glycopeptide peak (TN#ITLVCKPGDLESAPVLR, Man9). The reported precursor mass is 2 Da off the monoisotopic peak. (B) Precursor mass correction by averaging a window of MS spectra over the glycopeptide elution time greatly improves the isotopic distribution of the cluster by comparison with the theoretical pattern, thus improving the detection of monoisotopic mass. The precursor peak and the monoisotopic peak are marked by a red arrow.

