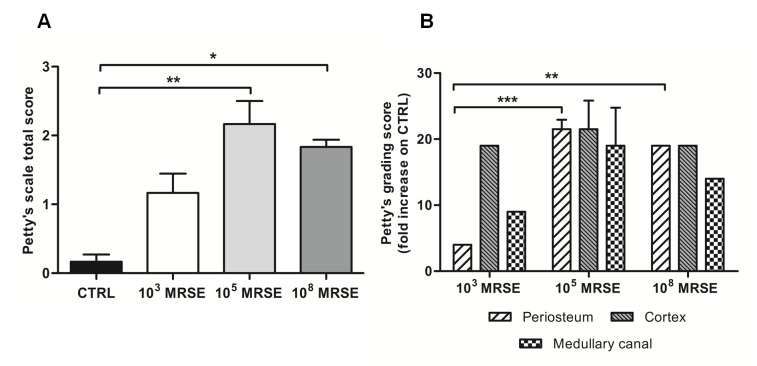
Fig 6. Histological score based on Petty’s scale.
The histogram compares the semiquantitative score performed on the periosteum, cortex and medullary canal regarding the osteomyelitis signs. (A) Total score analysis. (B) Fold increase of the grading scale of the infected groups with respect to the control group. Comparisons among groups were analyzed by one-way ANOVA. Statistical significance for P<0.05 (*), P<0.01 (**), P<0.001 (***), n = 5.

