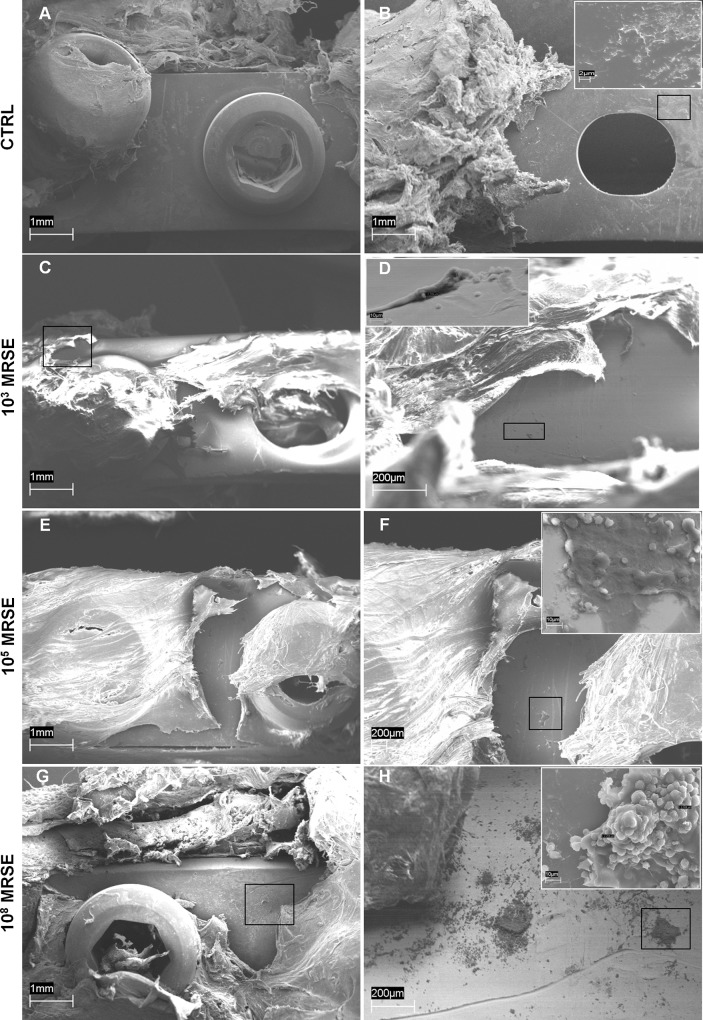
Fig 7. Representative photographs of SEM analysis of biofilm formation.
Absence of biofilm formation in the control group either on the top (A) or on the bottom (B) of the implanted plate (magnification 40x, scale bar 1mm) with the presence of bony bridging structure on the bone-implant interface (B small box, magnification 6700x, scale bar 2μm). Presence of few coccidal bacteria on the top of the plate (C, D, magnifications 40x and 250x, scale bars 1mm and 200μm, respectively) occasionally coated with mucoid material in the 103MRSE group (D small box, magnification 3000x scale bar 10μm). Presence of cocci within the peri-implant fibrous tissues covering the plate and on the top of the plate (E, magnification 40x, scale bar 1mm), free or partially embedded into mucous-gelatinous matrix in the 105MRSE group (F, magnification 70x, scale bar 200μm; F small box, magnification 3000x scale bar 10μm). Clusters of cocci adhering to the top of the plate surface (G, H, magnifications 40x and 90x, scale bars 1mm and 200μm, respectively) completely embedded in a well-organized biofilm matrix in the 108MRSE group (H small box, magnification 3000x, scale bar 10μm).

