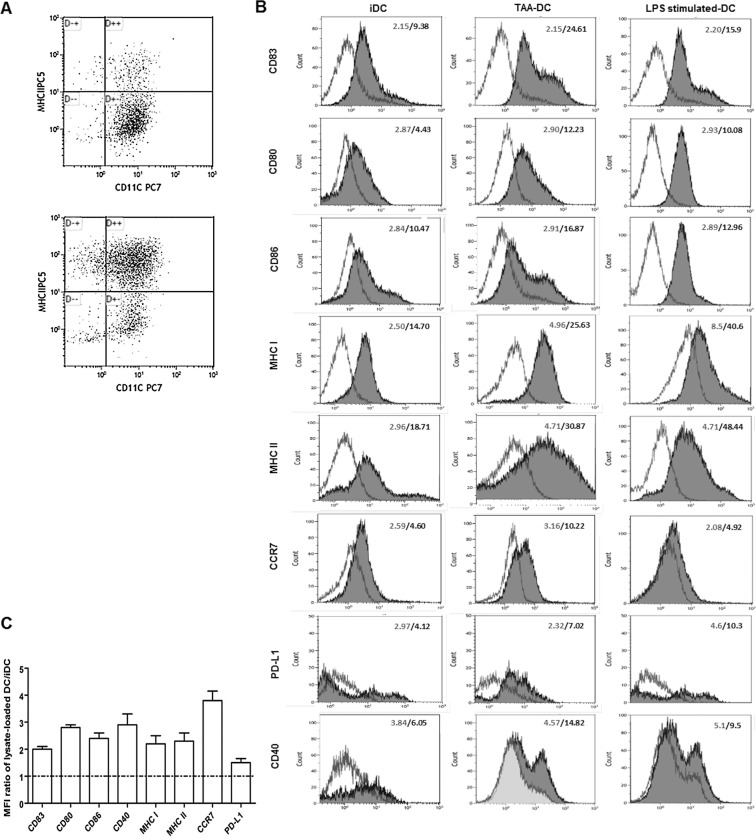
Fig 1. Immunophenotype of day-7 DCs.
Unpulsed immature DCs (iDCs), tumour lysate-loaded DCs (TAA-DCs) and LPS stimulated-DCs, were set up in parallel and harvested at the same time for phenotype analysis. DCs were identified by MHC-DR, CD11c (A) (upper dot blot and lower dot blot showing gating strategy and MHC II expression on CD11c+ cells before and after tumour lysate-loading and LPS stimulation, respectively) and the markers shown in the figure (B). The numbers indicate the MFI (mean fluorescence intensity) for the isotype controls (open histograms) and DC surface markers (shaded histograms). Representative results from one out of three experiments are shown here. Fold-increase in expression levels of maturation markers on tumour-lysate pulsed DCs over iDCs was determined by expressing the MFIs as a ratio of the TAA-DCs to unpulsed iDCs (C).

