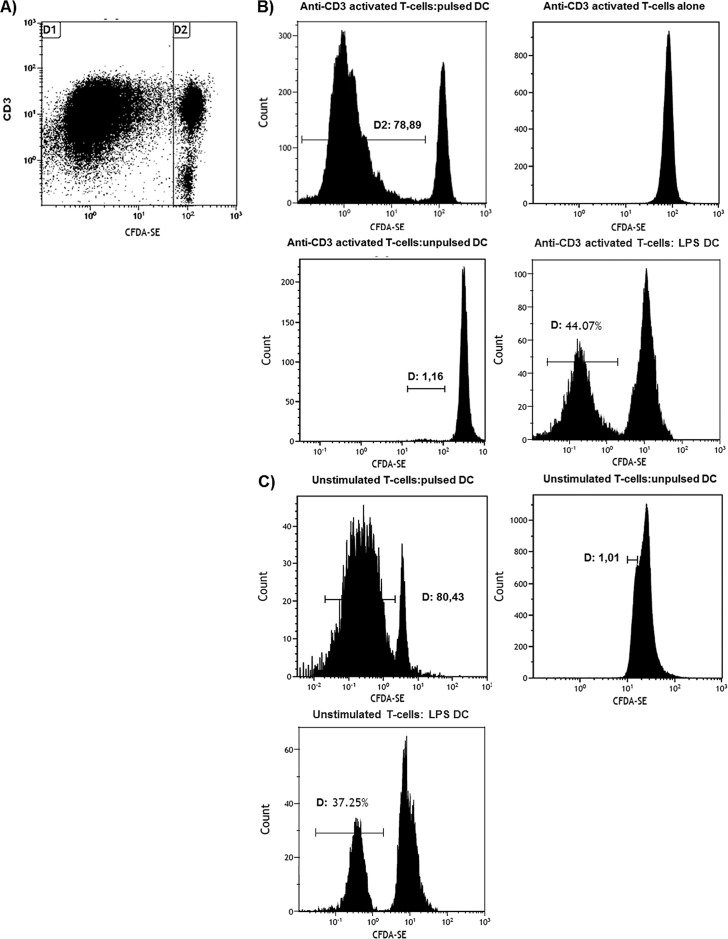
Fig 4. CFSE assay for assessment of T-cell function.
The 7 day response of CFSE-labelled syngeneic T-cells from the spleen of MMTV-Ras mice to stimulation with tumour lysate-pulsed DCs. CD3/CFSE dot plot (A) and CFSE histogram (B and C, anti-CD3 activated T cells and unstimulated T-cells, respectively) are shown. All plots were gated on CD3-positive cells, while the histograms were also gated to include both resting lymphocytes and blasts. (A): alterations in light scatter characteristics; (B and C): progressive two-fold dilutions of CFSE that accompanied mitotic cell division (gate D1). Both anti-CD3 activated and unstimulated T-cells were incubated with tumour lysate pulsed-DCs, unpulsed DC (negative control) and LPS-stimulated DCs (positive control). Application of an analysis algorithm (see Materials and Methods) resulted in a proliferation index of 2,93. One representative of three independent experiments is shown.

