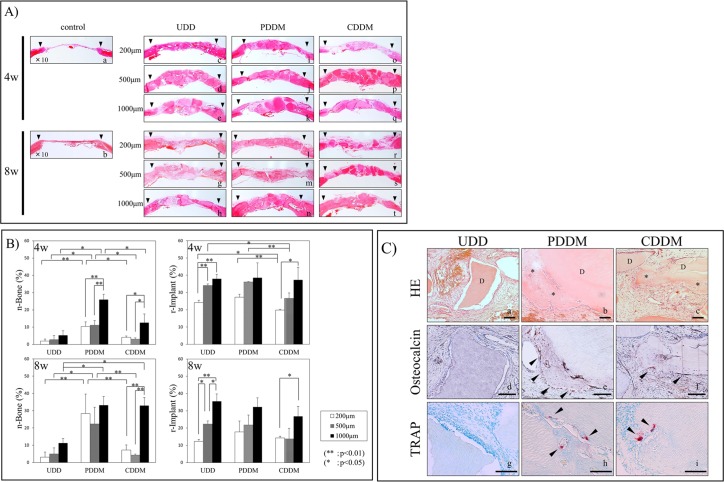
Fig 3.
A) Histological findings of HE stained sections at low-power magnification. The black arrowhead represents the edge of the cortical bone defect. In the UDD group, the area of newly formed bone was limited around the UDD in almost all sections (A-c, d, e, f, g). In the PDDM group, new bone formation surrounding the PDDM was evident at 4 weeks (A-i, j, k), especially in the 1000 μm samples (A-k). At 8 weeks, the newly formed bone is present in variable extents around PDDM, and complete closure in the surgical defect by consecutive new bone formation with PDDM is confirmed from end to end of the defect (A-l, m, n). In the CDDM group, the new bone formation is confirmed to be not only surrounding the CDDM, but also in the gaps between CDDMs (A-t) at 8 weeks in the 1000 μm samples. B) Quantitative micrograph analysis. Histomorphometric findings regarding n-Bone% and r-Imp% are shown. At 4 weeks, significant difference of n-Bone% is observed between the PDDM and other groups in each particle size. Within the PDDM and CDDM groups, the n-Bone% of 1000 μm particles showed a significant difference compared with those of the 200 μm and 500 μm groups. A significant difference in r-Imp% was observed between the CDDM and the other groups in the 200 μm and 500 μm samples. At 8 weeks, a significant difference in the n-Bone% was observed between the PDDM and the other groups in the 200 and 500 μm samples. In the 1000 μm group, the n-Bone% of PDDM and CDDM shows a significant increase in comparison with that of UDD. C) Histological findings of 1000 μm UDD, PDDM and CDDM at 4 weeks. This is the high-power magnification view of 1000 μm UDD, PDDM and CDDM sections stained with HE (C-a, b, c), Osteocalcin (C-d, e, f) and TRAP (C-g, h, i) at 4 weeks. New bone formation (* in C-b, c) surrounding PDDM and CDDM (D in C-b, c) was evident, and they were amalgamated. The maturation of new bone with many lacunae containing osteocytes (C-b) and some lining cells on the surface of the newly formed bone was evident. The presence of Osteocalcin–positive cells (arrowheads in C-e, f) and some TRAP-positive multinucleated giant cells (arrowheads in C-h, i) with Howship’s lacunae in that area was confirmed. Bars = 100 μm.

