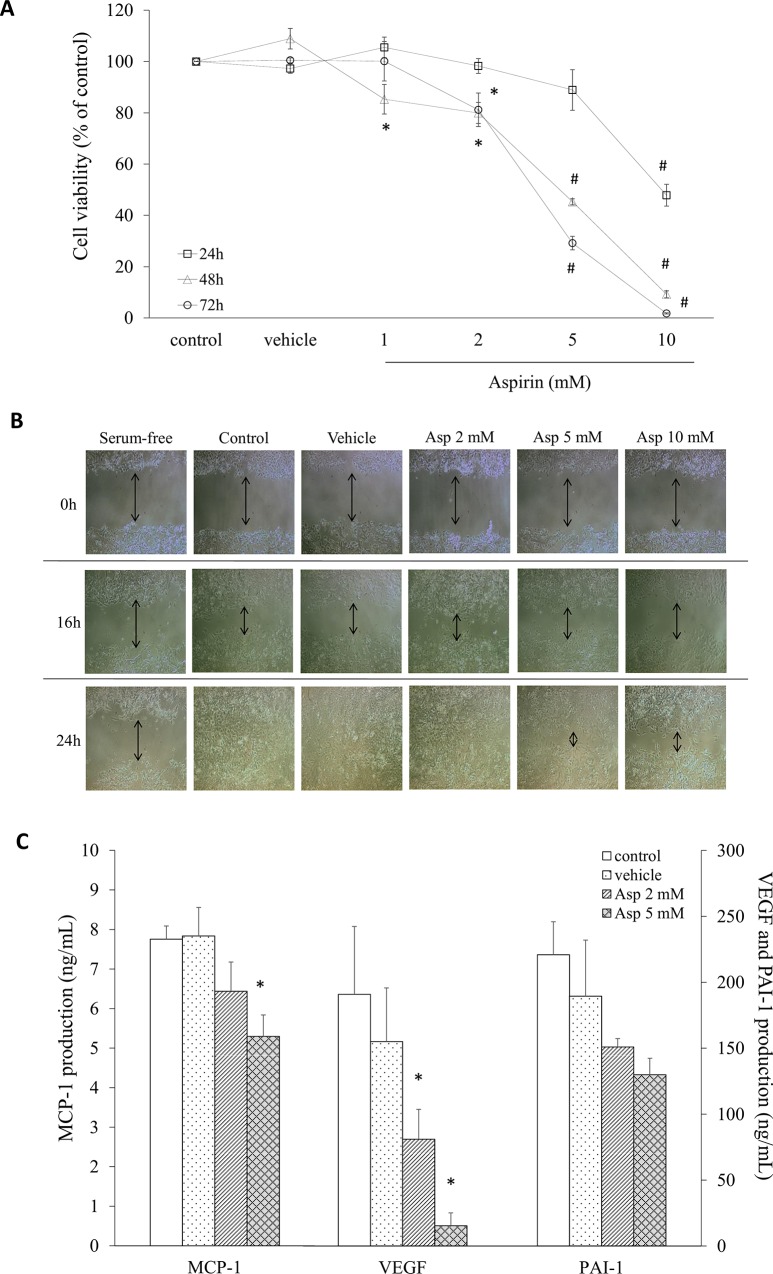
Fig 3. Cell growth and migration of 4T1 cells treated with aspirin.
A. The proliferation of cells treated with or without aspirin for 24, 48, and 72 h was analyzed using an MTT test. B. Migration patterns into the scraped area were observed for each condition and 4T1 cells were treated with or without aspirin for 16 and 24 h. C. The production of cytokines characteristic of tumors in the supernatant after a 24-h culture was measured by ELISA. Data are presented as mean ± SEM. Statistical analysis was done by one-way ANOVA and LSD post hoc test; significantly different at * p < 0.05 or # p < 0.001 vs. control group.

