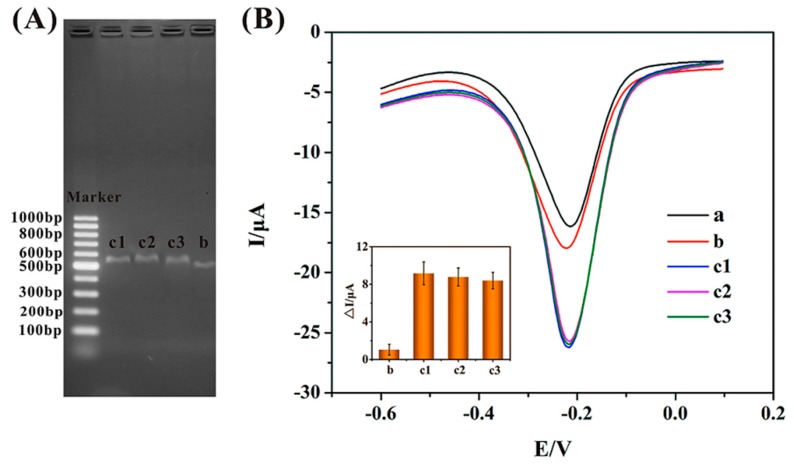
Figure 5.
(A) Agarose gel electrophoresis diagram of asymmetric PCR products. From left to right: DL1002 marker, F. thunbergii (c1, c2 and c3), F. cirrhosa (b), respectively; (B) Differential pulse voltammograms of different PCR products exposed to Tris-HCl buffer blank control (a), and hybridized with F. cirrhosa (b), F. thunbergii (c1, c2 and c3). Inset: Histogram of pure peak current corresponding to F. cirrhosa (a) and different F. thunbergii (c1, c2 and c3).

