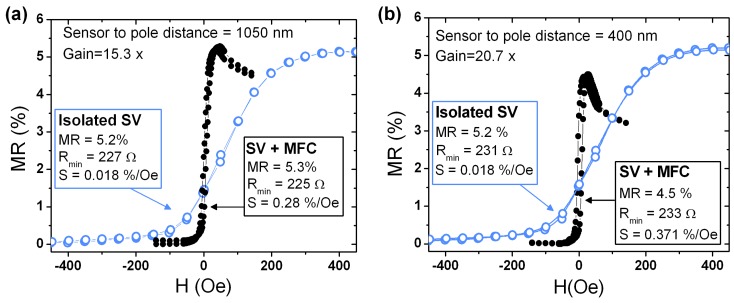
Figure 4.
Transfer curves (I = 100 μA) for selected devices displaying the maximum sensitivity gain achieved, comparison the isolated SV curve with the corresponding device including the MFCs with a pole to sensor distance of (a) 1050 nm, the largest fabricated and (b) 400 nm, the smallest fabricated.

