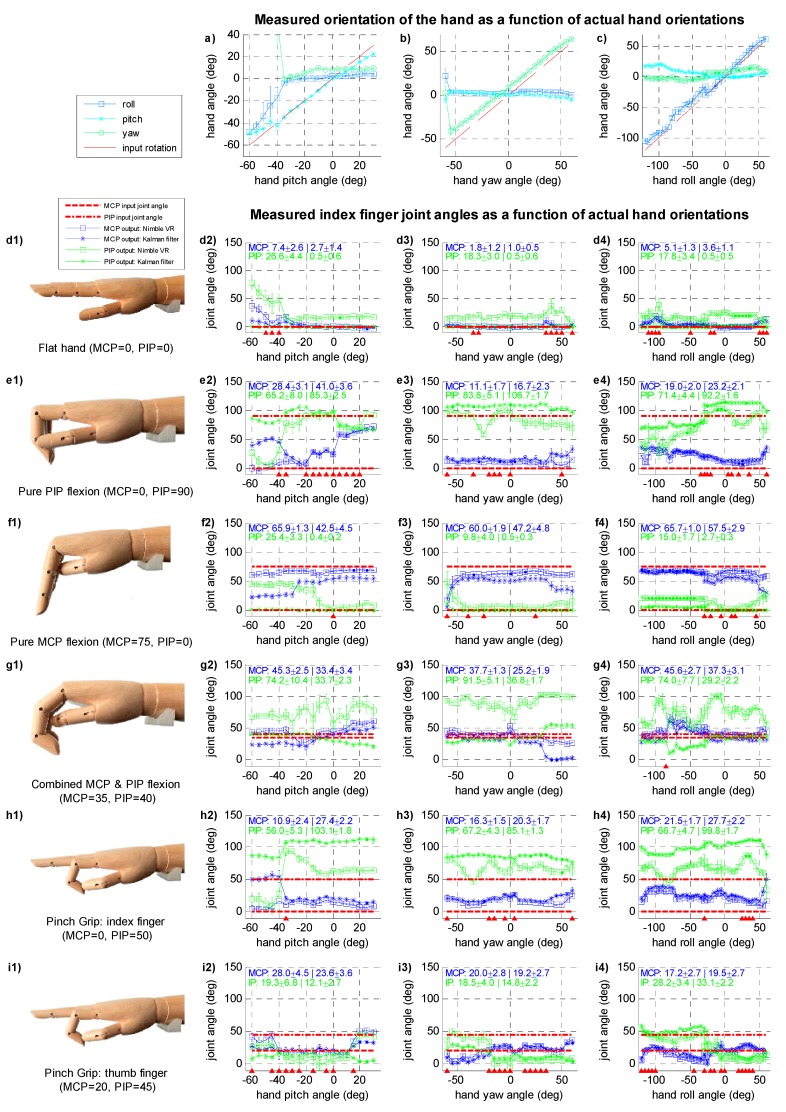
Figure 2.
(a–c) Three plots providing measured orientation of the wooden hand model for varying actual hand orientations (i.e., pitch, yaw, and roll), indicated by red dashed unity lines; (d1–i1) Photos of the measured hand orientations; (d2–i4) Plots showing the measured metacarpophalangeal joint (MCP, blue) and proximal interphalangeal (PIP, green) joint angles, as determined with the Nimble VR system (square markers, □) and after fusion of the Data Glove data through the application of the Kalman filter (asterisk markers, *). Data is presented with error bars ranging from mean – 1·SD to mean + 1·SD. The actual angles at which the fingers were placed are indicated with the red dotted and dash-dotted lines, and are illustrated in the photos provided on the left. All plots show data collected on the index finger, unless otherwise specified below the photo on the left. Indicated in the top left of every graph are the mean and standard deviation (format: mean ± SD | mean ± SD) calculated over the entire hand orientation range before (left) and after implementation of the Kalman filter (right), for both joints. Note that these mean and standard deviations are calculated as the mean of the mean, and the mean of the standard deviations, calculated per 5 deg step. The triangle markers on the horizontal axes indicate whether the difference in mean PIP joint angle between Nimble NR and the Kalman filter is not statistically significant (note: MCP joint is not visualised in this way).

