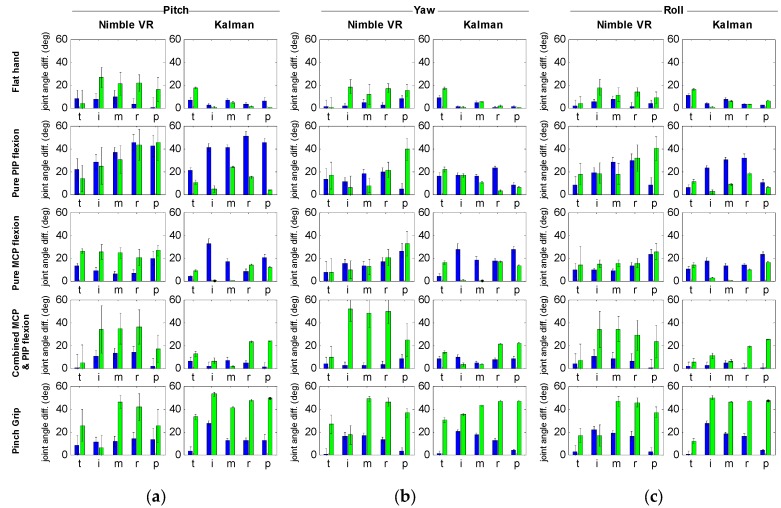
Figure 3.
Precision and accuracy for all fingers of the hand model and for all orientation ranges. (a) Pitch range; (b) Yaw range; (c) Roll range. For each graph, the absolute difference is given between the mean calculated joint angle (i.e., mean of the mean joint angles) and the true joint angle. The accompanying standard deviation is given as well (i.e., the mean of the standard deviations at all angles), shown as ± 2·SD. Note that the values provided here are equal to the values given in the top left of the graphs in Figure 2 minus the true joint angles of the assessed hand pose. A distinction is made between the Nimble VR data (left) and the Kalman filtered date (right), as well as between the metacarpophalangeal (MCP, blue) and proximal interphalangeal (PIP, green) joint. From left to right the fingers are presented; t = thumb, i = index, m = middle, r = ring, p = pinky.

