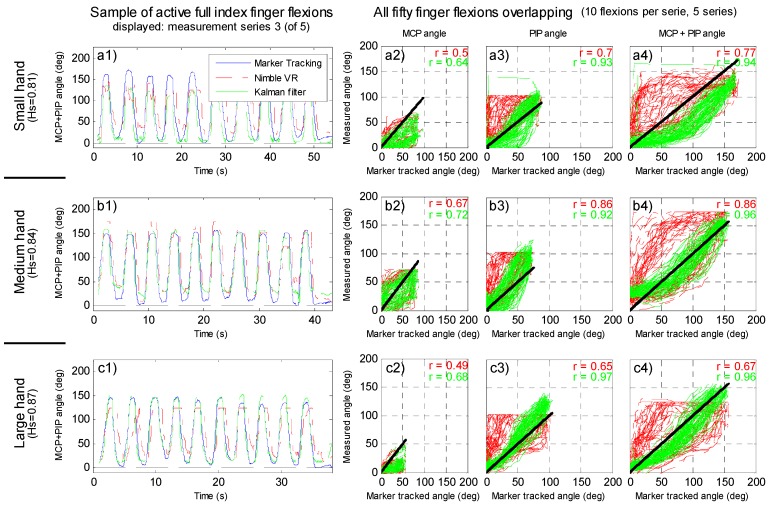
Figure 4.
Finger joint estimates at dynamic finger flexions. (a1–a4) small hand size; (b1–b4) medium hand size; (c1–c4) and large hand size. Five sessions with 10 full finger flexion repetitions each were performed. All graphs show the Nimble VR system (red dash dotted line), Kalman filter output (green dashed line), and Marker Tracking measurements (blue continuous line). Left three graphs show the combined metacarpophalangeal (MCP) and proximal interphalangeal (PIP) joint angles of the third performed measurement session. The remaining nine plots show the Nimble VR and Kalman filter output plotted vs. the Marker Tracked angles of all fifty finger flexions performed per hand. The black line presents the true angle, and the plots are given for separate and combined joints: (a2–c2) MCP; (a3–c3) PIP; (a4–c4) combined MCP plus PIP joints. In the top right, the Pearson correlation coefficient between the measured angle and marker tracked angle are given (red = Nimble VR, green = Kalman filter output).

