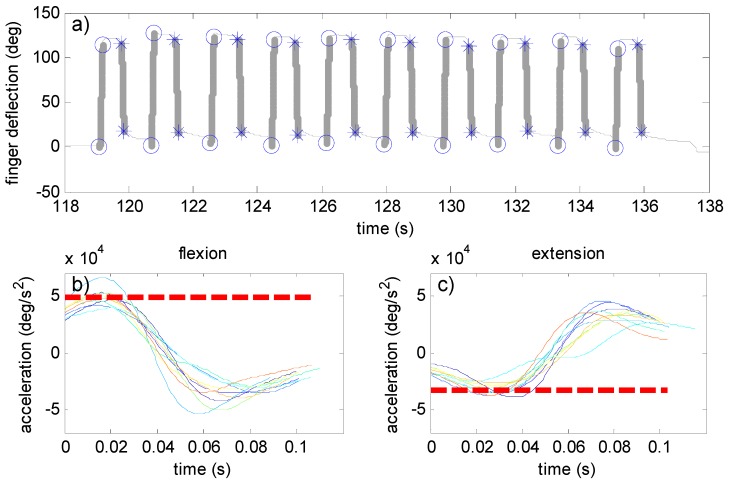
Figure B1.
Top: (a) Index finger motion measured with 5DT Data Glove during 10 times as-fast-as-possible finger flexions of a single participant. Indicated with a bold line are the flexion and extension movements with their respective marker indicators (o and *) showing starting and stopping points of the finger motions; (b) calculated accelerations over the course of every finger flexion superimposed over each other; (c) similar as subfigure b, but for finger extensions. The horizontal (red) dotted lines show the mean peak accelerations determined from the datasets. (Note: this participant was faster than average.)

