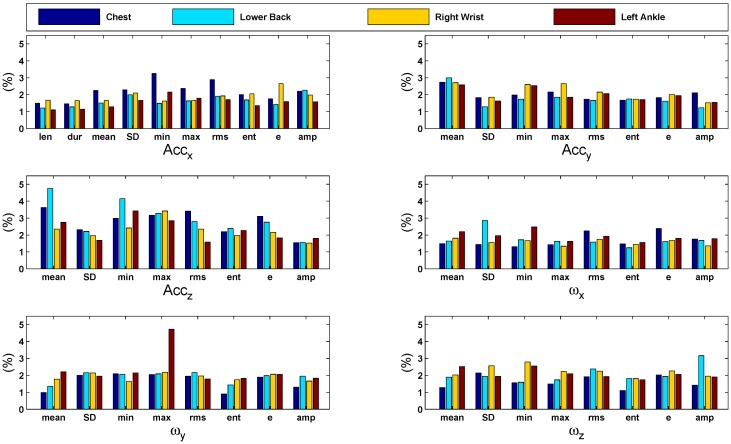
Figure 8.
Bar graphs of the features’ importance computed during age classification using the 10-fold cross-validation strategy. The graphs present a comparison of the importance of each feature (in %) with respect to different sensor positions. In general, all features are significantly contributing in the classification task.

