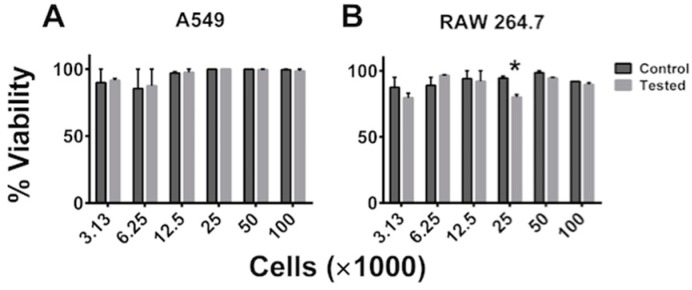
Figure 3.
Cell viability following SAW measurement. Immediately following SAW measurement the viability of (A) A549 and (B) RAW 264.7 cells was determined by trypan blue exclusion. Data is plotted as mean ± standard error of the mean. The data is a representative of a study that was performed in triplicates and performed at least two independent times. A student’s t-test was used to evaluate significance (* p ≤ 0.05, when compared to control).

