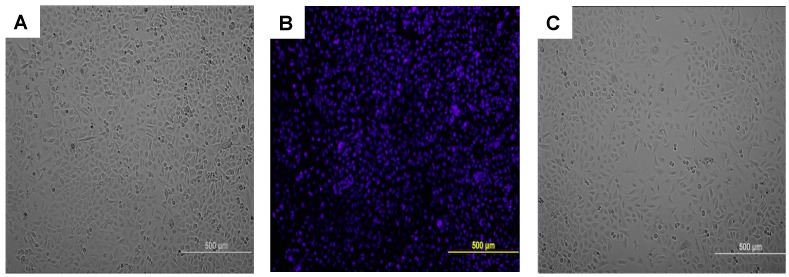
Figure 4.
Cell proliferation following SAW measurement. Immediately following SAW measurement A549 cells were seeded onto a 96-well plate at a density of 5000 cells per well. Representative images of control and tested groups are shown: (A) A549 cells 72 h after SAW test; (B) NucBlue staining of A549 cells 72 h after test; and (C) Control cells after 72 h.

