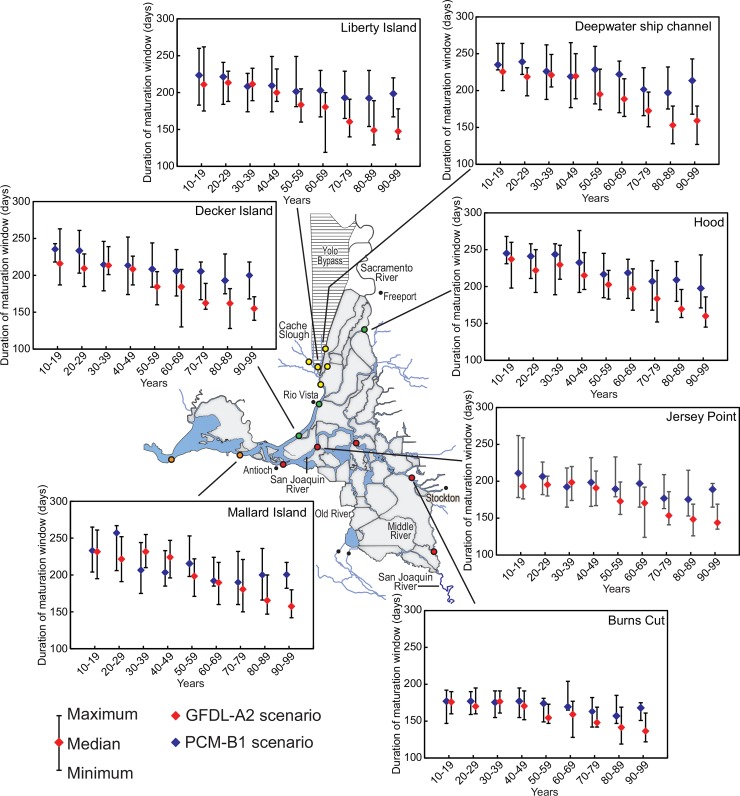
Fig 4. Plots of median, maximum, and minimum for number of days each year with calculated average daily water temperature within the maturation window for juvenile Delta Smelt at selected sites during the indicated decades during the 2000s.
Results from the warmest scenario (GFDL-A2) and coolest scenario (PCM-B1) considered are shown.

