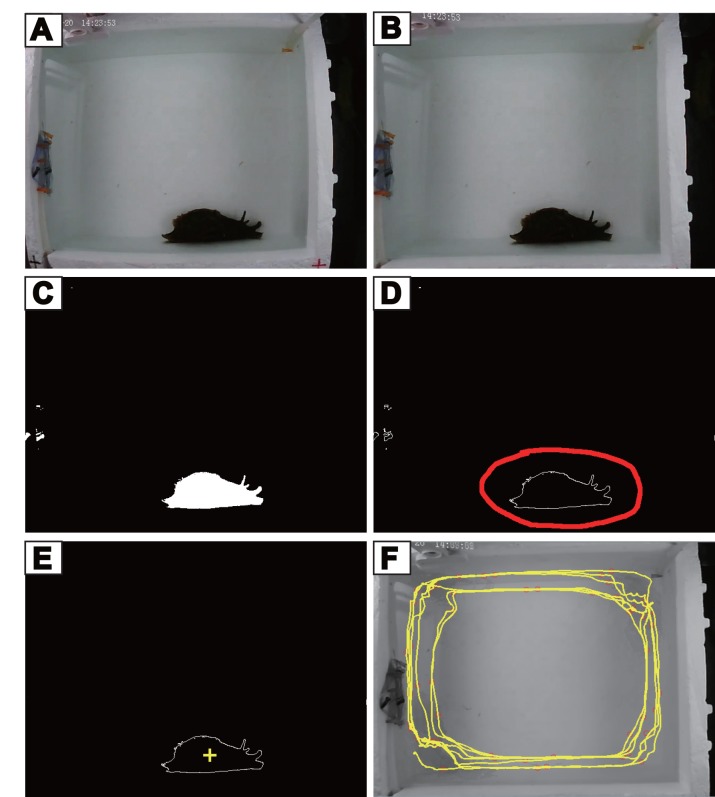
Fig 2. Video analysis procedure.
(A) The raw image from a video frame; (B) The image after camera calibration and alignment; (C) The image after color detection and threshold value calculation showing animal outline in white; (D) object-recognition, the object (Aplysia) is circled in red line; (E) marking (yellow +) of the object center of gravity; (F) an example of movement path (shown in yellow) of Aplysia (1 hr).

