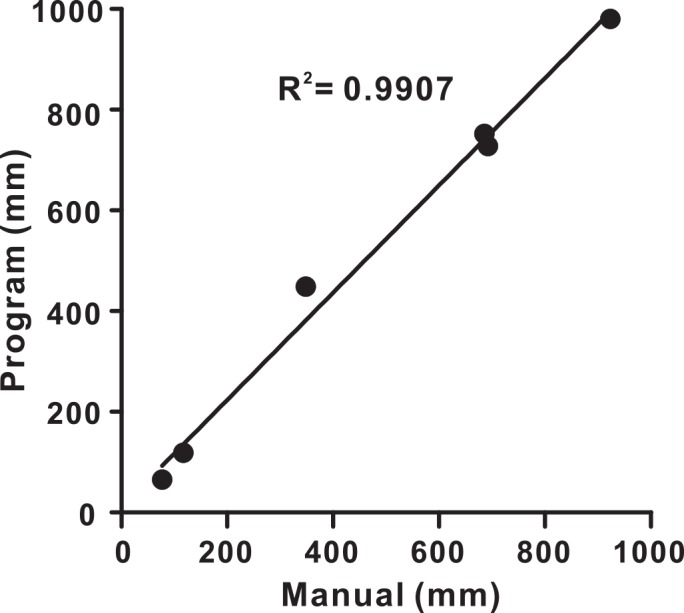
Fig 3. Validation of the program.

Plot of the paths (in mm) that animals traveled in six video segments determined both manually and automatically by the program. The thick line is the linear regression fit. The two sets of path data were highly correlated with a slope of 1.066.
