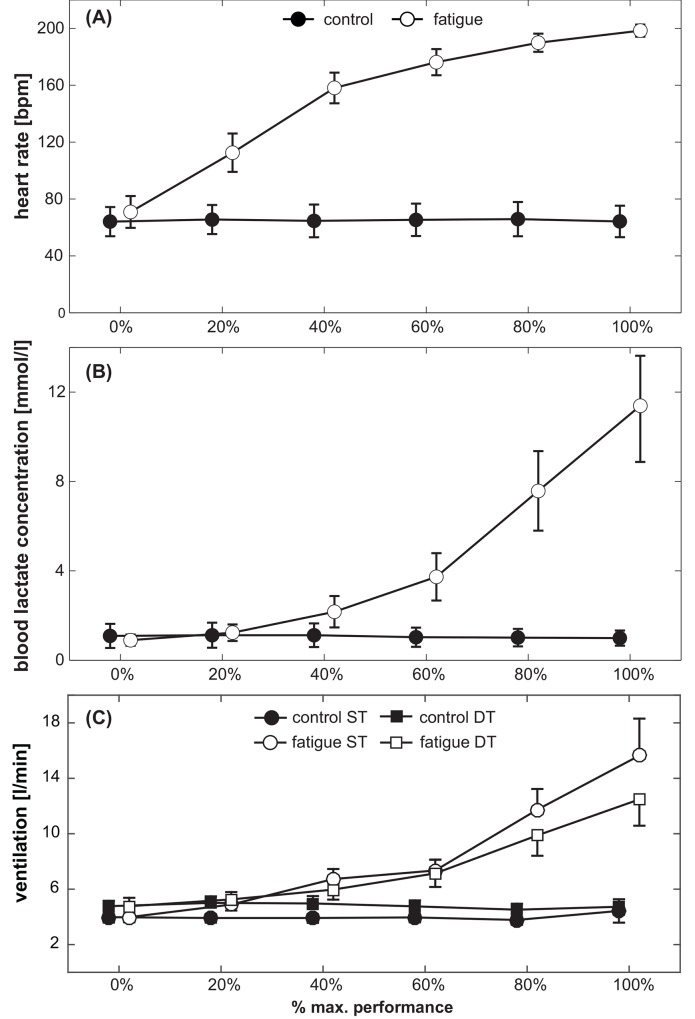
Fig 2. Subjects’ (A) heart rate, (B) blood lactate levels and (C) ventilation during each of the 6 different stages, displayed separately for the fatigue condition (white symbols) and the control condition (black symbols).
For ventilation, data is separately displayed for ST (circles) and DT (squares) conditions. Symbols represent mean values; error bars the respective 95% confidence interval.

