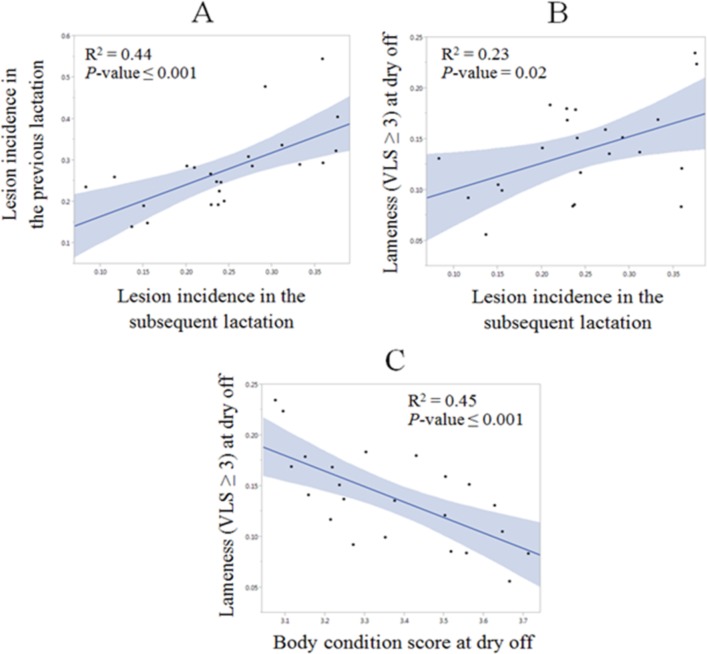
Fig 4. Linear regression scatter plots.
Linear regression scatter plots (fitted lines with confidence intervals in grey) indicating (A) the positive association of the farm level incidence of claw horn disruption lesions (CHDL) in the previous lactation (Y axis) and the farm level incidence of CHDL in the subsequent lactation (X axis); (B) the positive association of the prevalence of lameness (visual locomotion score > 2) at drying off (Y axis) and the farm level incidence of CHDL in the subsequent lactation (X axis); (C) the negative association of the prevalence of lameness (visual locomotion score > 2) at drying off (Y axis) and the body condition score at drying off (X axis).

