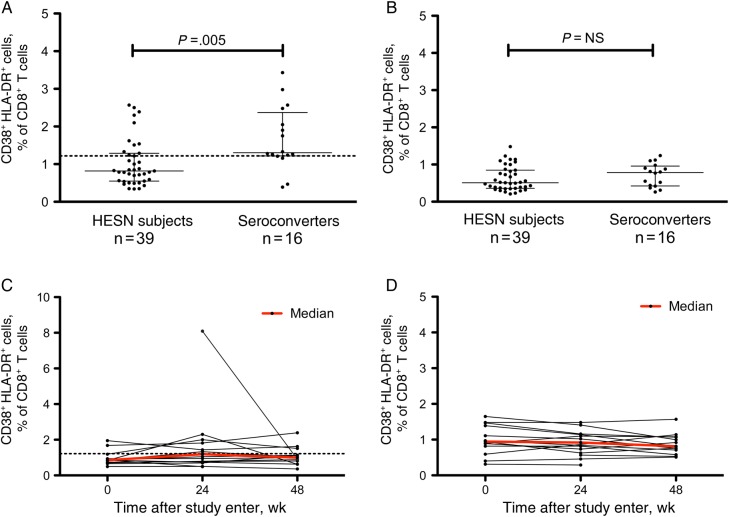
Figure 1.
A and B, Median percentages (interquartile ranges) of CD38+HLA-DR+ cells among CD8+ (A) and CD4+ (B) T cells obtained from subjects who were exposed to but seronegative for human immunodeficiency virus type 1 (HIV-1; HESN) and subjects who tested negative for HIV-1 at study entry but seroconverted after enrollment. Data were analyzed using the Wilcoxon rank sum test. C and D, Activation over time of CD8+ (C) and CD4+ (D) T cells obtained from 14 HESN subjects. The dotted line indicates 1.22%, which is the 25th percentile of the frequency distribution of CD38+HLA-DR+ CD8+ T cells in subjects who seroconverted.

