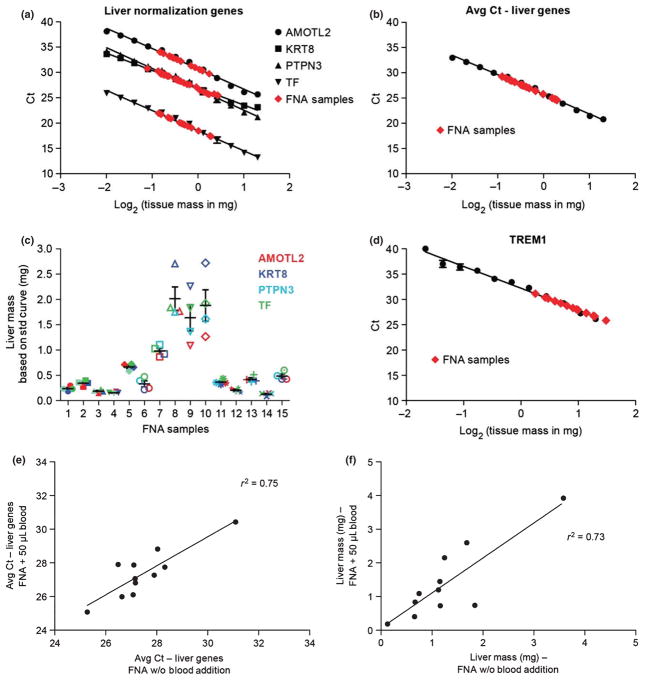
Fig. 3.
Quantification of FNA liver mass by assessment of liver normalization genes in dog. Standard curves were generated from liver punches as described in methods and represent the average of two standard curves derived from each of four separate dog experiments. X-axis indicates log-transformed liver tissue mass and Y-axis indicates threshold cycle (Ct). (a) Expression of the liver-enriched normalization genes AMOTL2 (circle), KRT8 (square), PTPN3 (triangle) and TF (inverted triangle) (expressed as Ct value) is linear with respect to liver input in dog liver standard curve. (b) Average expression of the four normalization genes in dog liver standard curve is expressed as average Ct value. (c) FNA liver mass determinations calculated from the standard curves in A. Error bars illustrate the standard error of the mean. (d) Expression of the gene, TREM1, in dog liver standard curve. Gene expression determination of samples obtained by fine needle aspiration (FNA) is shown in red (panels a, b and d). (e) Effect of blood addition on measured liver-enriched gene expression levels as assessed using linear regression analysis of average liver Ct values in FNA samples with (Y-axis) and without (X-axis) blood addition. (f) Liver mass estimation using linear regression analysis in FNA samples with (Y-axis) and without (X-axis) blood addition.

