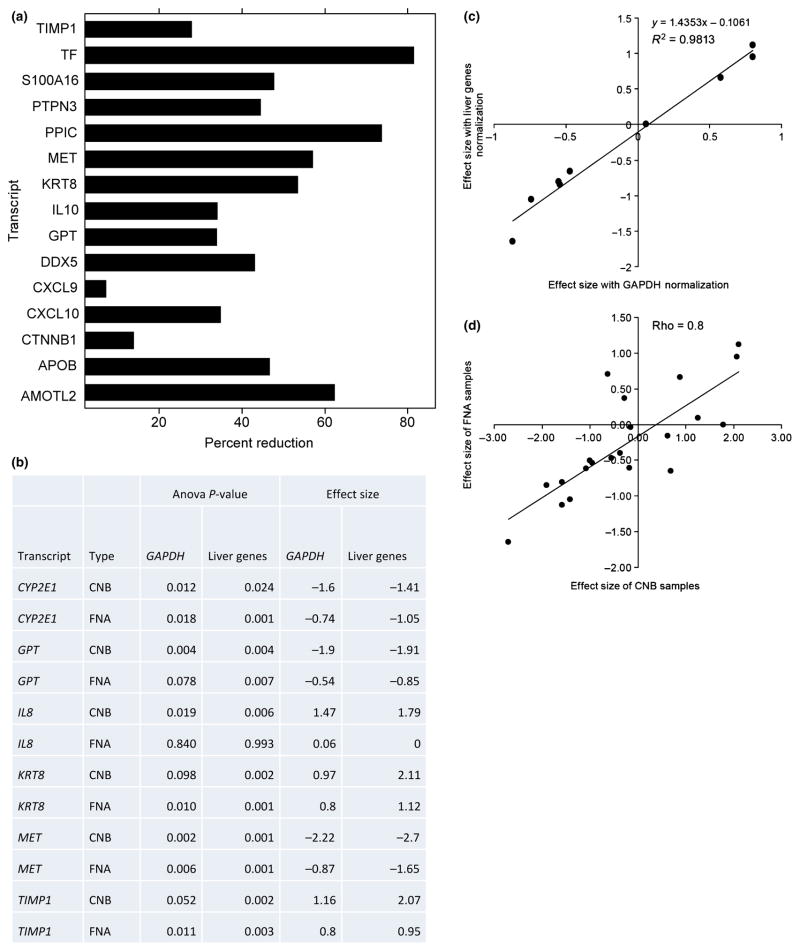
Fig. 4.
Sources of variability in liver samples obtained by liver fine needle aspiration. (a) Percentage reduction in total variance after adjustment for blood contamination. Total variance is calculated as the sum of the estimates of components of variance due to patient, visit and fine needle aspiration (FNA) procedure. Only genes which showed a positive definite structure for the random effects are shown. (See Supporting information). (b) Significant genes and effect sizes identified on using liver-specific normalization genes compared to normalization using GAPDH on samples obtained by core needle biopsy (CNB) and FNA. Significant differences are defined at P-value<0.01 to compensate for multiple testing. (c) Scatter plot and linear regression analysis of effect sizes for the differences between mild and severe fibrosis from FNA samples. Y-axis corresponds to effect sizes calculated using liver-specific genes. X-axis corresponds to normalization using GAPDH. Each data point corresponds to a gene from the list (CTNNB1, CXCL10, CYP2E1, GPT, IL8, KRT8, MET, PDGFB and TIMP1). Linear regression and R2 are illustrated. (d) Scatter plot of effect sizes for the differences between mild and severe fibrosis from FNA and CNB samples. Y-axis corresponds to effect sizes in FNA. X-axis corresponds to CNB samples. Each data point corresponds to a gene from the list (AMOTL2, APOB, CTNNB1, CXCL10, CXCL9, CYP2E1, DDX5, GPT, IL10, IL6, IL8, KRT8, MAPK1, MET, PDGFB, PPIC, PTPN3, S100A16, TF, TIMP1 and TREM1). Pearson correlation coefficient is illustrated.

