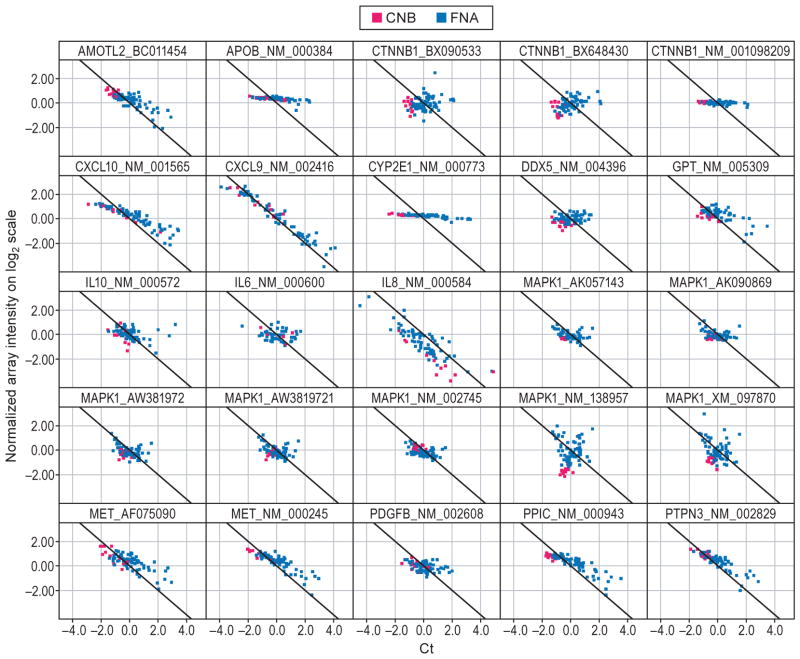
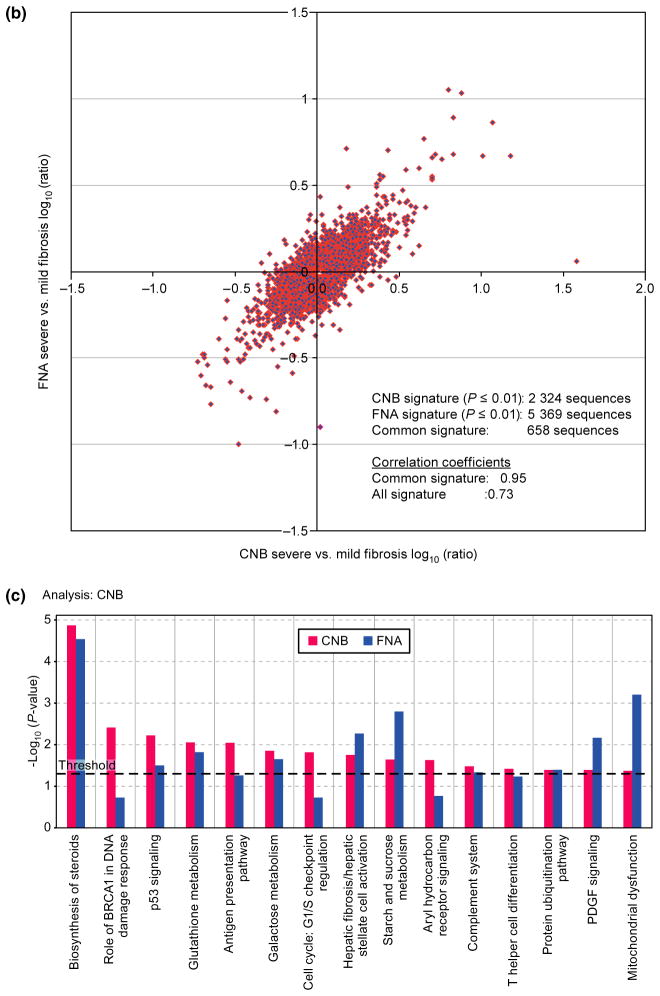
Fig. 5.
Agreement in gene expression in samples obtained by core needle biopsy and fine needle aspiration. (a) Scatter plot of mean normalized log2 transformed intensity values vs standardized TaqMan assay Cts. Black line corresponds to ideal relationship between microarray and TaqMan assay data. Negative correlation is due to reverse scale of TaqMan assay, the higher the Cts the lower the transcript expression levels. Red and blue colours correspond to core needle biopsy (CNB) and fine needle aspiration (FNA), respectively. (b) Correlation analysis between CNB and FNA signatures. Analysis was performed by combining severe fibrosis samples and referenced to the mild fibrosis gene expression pool of its own sample type (i.e. CNB or FNA). Correlation of fibrosis signature genes between CNB and FNA samples is 0.73, P ≤ 0.01. (c) The canonical pathways most associated with severe fibrosis signatures from CNB (red) and FNA (blue) samples based on the Ingenuity Pathway Analysis (IPA). Y-axis depicts log-transformed P-value.


