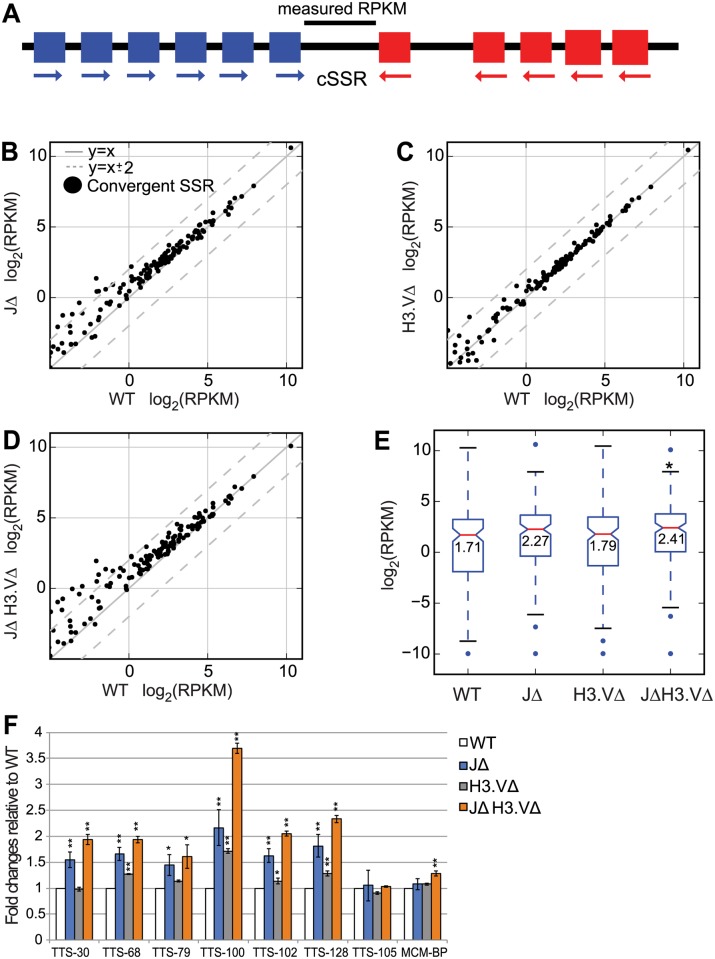
Fig 3. The absence of base J and H3.V results in an increase in the number of transcripts between genes that flank convergent SSRs.
(A) Schematic, the log2(RPKM) value is computed only for the region lying between the two genes that flank the cSSR. (B-D) Scatter plots showing log2(RPKM) values for WT and indicated mutant cells computed for regions between genes that flank the cSSR, defined as between the 3´ end of the last gene in the (+) strand PTU and the 5´ end of the first gene in the (-) strand PTU. Dotted grey lines indicate changes that are 4-fold up or down. Comparisons between WT and JΔ cells are shown in (B), WT and H3.VΔ cells in (C), and WT and JΔ H3.VΔ cells in (D). (E) Boxplot for log2(RPKM) values computed for the regions plotted in B-D. Boxplots are displayed as in Fig 2G. * indicates a significant difference (P < 0.05) as measured by a Mann-Whitney U test. ** P < 0.01 (F) q-PCR experiment on total RNA in WT and mutant cells to determine transcripts level at selected TTSs. TTS-30, 68, 79, 100, 102, and 128 all showed higher expression of polyA+ RNA in JΔ H3.VΔ cells when compared to WT cells in the RNA-seq experiment. TTS-105 did not show upregulation in the RNA-seq dataset and was used as a negative control. MCM-BP primers were used as an additional negative control. Significance is measured using a Student’s T test.

