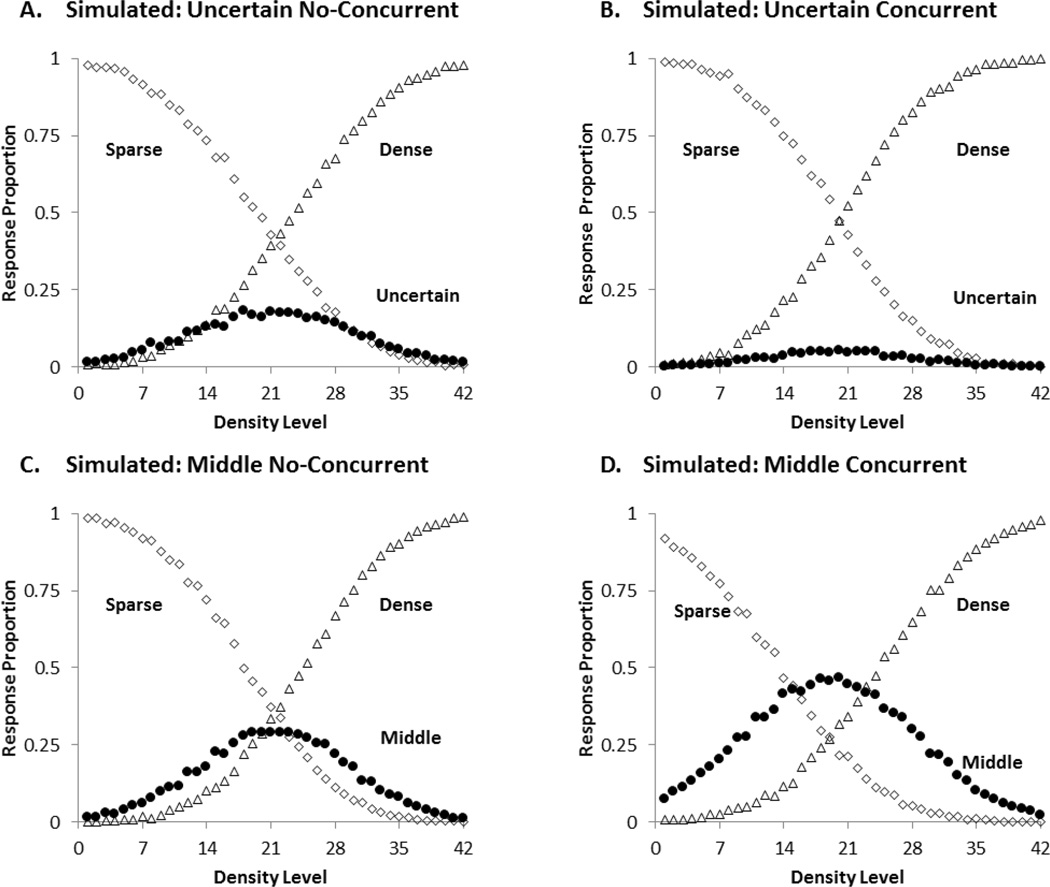
Figure 3.
The best-fitting predicted profile for the four conditions of the first experiment.A: Uncertain No-Concurrent, B: Uncertain Concurrent, C: Middle No-Concurrent, D: Middle Concurrent. The black circle illustrates the predicted proportions of intermediate (uncertainty or middle) responding. The open diamonds and open triangles show the predicted proportions of sparse and dense responding, respectively.

