. 2015 Dec 7;4:e11386. doi: 10.7554/eLife.11386

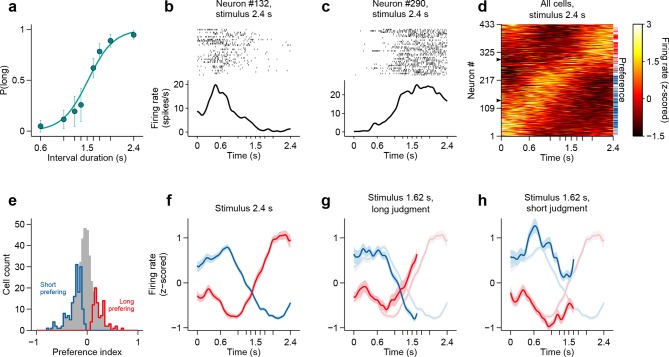
Figure 2. Dynamics of striatal subpopulations predict duration judgments.

(a) Psychometric function for neural recording sessions (mean ± standard deviation across sessions and logistic fit, n = 37 sessions from 3 rats). (b,c) Raster plot and peri-stimulus time histogram (PSTH) of two example cells for trials in which the longest stimulus interval (2.4 s) was presented. Time = 0 corresponds to stimulus onset. (d) Normalized PSTHs of all neurons for trials in which the longest stimulus interval was presented. Arrowheads indicate cells shown in (b,c). Blue and red ticks indicate cells with significant short and long preferences, respectively. (e) Histogram of preference indices. Blue and red outlines indicate subpopulations with significant short and long preferences, respectively. (f) Averaged, normalized PSTH of the two subpopulations outlined in (e) for trials in which the longest stimulus interval was presented (mean ± SEM). (g) Same as in (f), for trials in which a near-boundary stimulus interval (1.62 s) was judged as long. For comparison, curves shown in (f) are reproduced as a watermark. (h) same as (g) for trials in which the stimulus was judged as short. For single subjects, see Figure 2—figure supplement 2 . Behavior and neural spike count data for Figure 2 and Figure 2—figure supplements 1 and 2 can be found in Figure 2—source data 1.

DOI: http://dx.doi.org/10.7554/eLife.11386.006

Figure 2—source data 1. Folder with raw data for Figures 24.
Each file in the source data folder is named “‘<animal>_<session>"’, and contains an 8x2 cell "‘spikeCounts"’. For each of the eight stimuli and two choices, "‘spikeCounts"’ contains a matrix of spike counts with dimensions:number of neurons x number of trials x number of time steps. The stimuli (delay to the second tone in seconds) and choices are ordered as follows:STIM_SET = [0.60 1.05 1.26 1.38 1.62 1.74 1.95 2.4];CHOICES = ['incorrect' 'correct'];The spike counts are given from 500 ms prior to trial initiation up to 500 ms after the time of the second tone and were binned in 2 ms wide bins.This folder also includes underlying data for Figures 3 and 4.
DOI: 10.7554/eLife.11386.007

Figure 2.

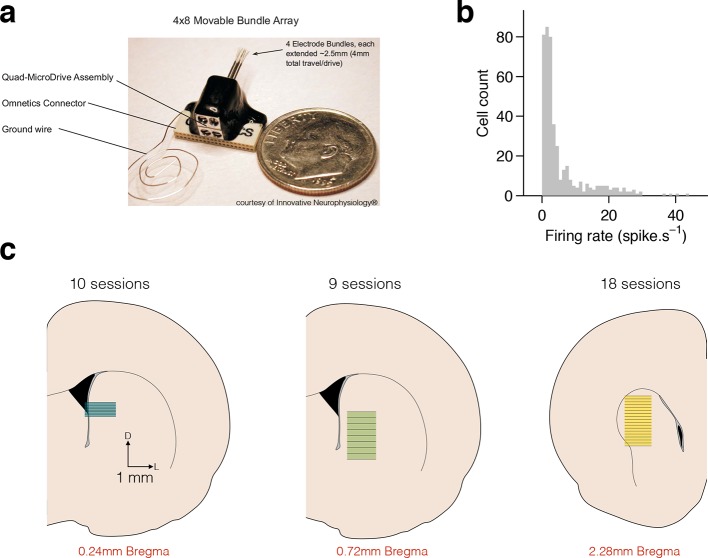
Figure 2—figure supplement 1. Electrophysiological recordings in dorsal striatum.

Figure 2—figure supplement 1.

(a) Movable microwire bundle array (Innovative Neurophysiology) used for all neural recordings. (b) Histogram of firing rates for all selected cells (bin size 1 spike/s). (c) Schematic representation of the striatal recording sites. Coronal slices at intermediate AP positions are shown for reference (left to right, rats Bertrand, Edgar and Fernando). Colored rectangles show the approximate DV position of the wire bundles across recording sessions and horizontal black lines represent session by session recording sites, for 10, 9 and 18 recording sessions, respectively.

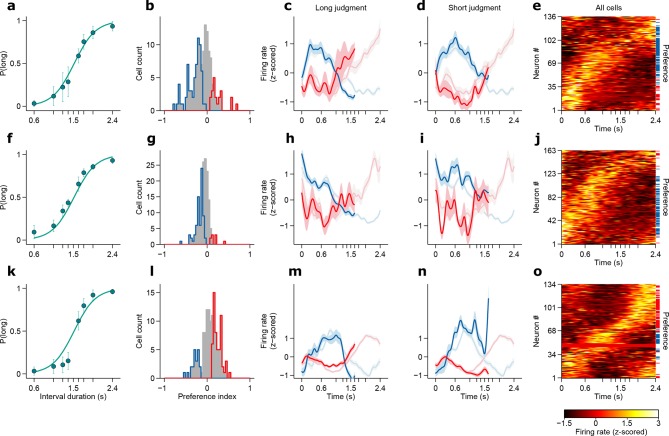
Figure 2—figure supplement 2. Dynamics of striatal subpopulations predict duration judgments.

Figure 2—figure supplement 2.

(a,f,k) Psychometric functions for the recording sessions of rats Bertrand (a), Edgar (f) and Fernando (k) (mean ± standard deviation across sessions and logistic fit). (b,g,l) Histograms of preference indices for the same individual animals. Blue and red outlines indicate subpopulations with significant short and long preferences, respectively. (c,h,m) Averaged, normalized PSTHs of the two subpopulations outlined in (b,g,l) for trials in which the a near-boundary stimulus interval (1.62 s) was judged as long (mean ± SEM). (d,i,n) same as in (c,h,m) for short judgment trials. (e,j,o) Normalized PSTHs of all neurons for each animal for trials in which the longest stimulus interval was presented. Blue and red ticks indicate cells with significant short and long preferences, respectively.