
Figure 2. Disrupting synchronized mass spawning in the coral, Acropora millepora.
(A) Beginning 8 days prior to the spawning night, A. millepora colonies were exposed to one of the following treatments: ambient (A), in which colonies were exposed to natural day and night cycles with full exposure to moon light; light (L), in which colonies were exposed to natural daylight during the day and artificial photosynthetically active radiation (PAR) light (~5 µmol quanta m-2 s-1) at sunset every day for ~6 hrs (between 18:15 and 24:00) and then left in the dark until sunrise; or dark (D), in which colonies were exposed to natural daylight during the day and left in the dark from 18:15 to sunrise. (B) Hierarchical clustering of A. millepora gene expression data for the 184 coral transcripts that were only variable during the spawning night, depicting gene expression changes between treatments A, L and D denote ambient, light and dark treatments, respectively.

Figure 2—figure supplement 1. Hierarchical clustering of Acropora millepora gene expression data for (A) the 177 coral transcripts that were up-regulated and (B) the 29 coral transcripts that were down-regulated during the spawning night.

Figure 2—figure supplement 2. Correlation of gene expression Log2 fold change between values obtained from RNA-seq analysis and expression values obtained using quantitative PCR (qPCR).
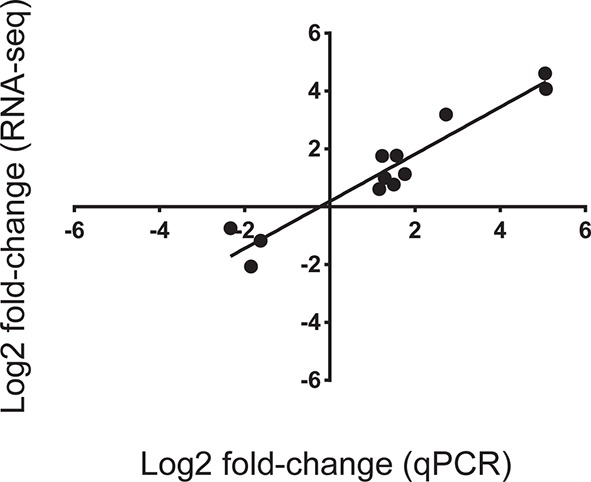
Figure 2—figure supplement 3. The effect of light quantity and quality on the timing of broadcast spawning in the coral Acropora millepora at Heron Island.
