. 2016 Jan 12;5:e11860. doi: 10.7554/eLife.11860

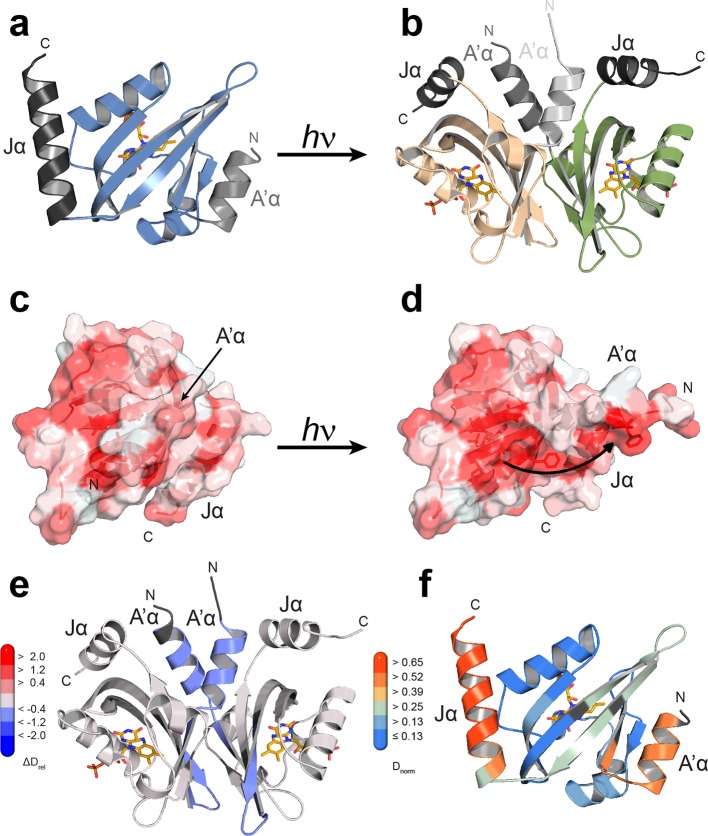
Figure 4. Structural characterization of PtAu1aLOV in its dark and light state.

(a) Crystal structure of the PtAu1aLOV dark state monomer with the N- and C-terminal A'α and Jα helices flanking the LOV core colored in light gray and dark gray, respectively. (b) Blue light illumination induces formation of a parallel PtAu1aLOV dimer. (c) In the dark, A'α covers the hydrophobic dimerization site on the LOV β-sheet. (d) Illumination results in a release of A'α from the LOV β-sheet and exposes the dimerization site. The PtAu1aLOV molecules in (c and d) are colored according to the Eisenberg hydrophobicity scale (Eisenberg, et al., 1984). Reddish regions correspond to high and white regions to low hydrophobicity. (e) The PtAu1aLOV light state dimer colored according to differences in deuterium incorporation in the dark and light state after 10 s of labeling. Shades of red and blue correspond to regions with increased and decreased deuterium uptake in the light, respectively. A peptide map that shows the differences in relative deuteration of dark and light experiments for all time points is shown in (Figure 4—figure supplement 3). All evaluated peptides for PtAu1aLOV and their individual deuteration plots are shown in (Figure 4—figure supplement 4). (f) PtAu1aLOV dark state monomer colored according to deuterium incorporation in the dark after 10 s labeling. Elements in (e) and (f) colored in dark gray represent regions that are not covered by peptides generated by pepsin digestion. Since rapid back-exchange of the two N-terminal residues prevents precise measurement of deuterium incorporation, these residues of all peptides are shown in dark gray, if not covered by an overlapping peptide. LOV, light-oxygen-voltage.

DOI: http://dx.doi.org/10.7554/eLife.11860.010

Figure 4.

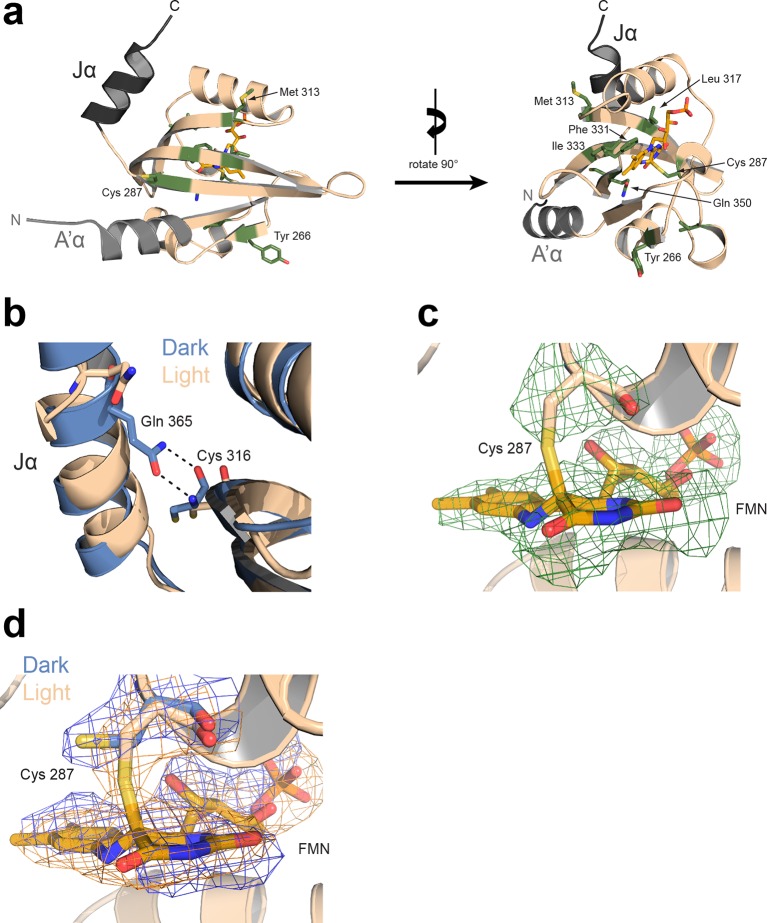
Figure 4—figure supplement 1. Light-induced structural changes of PtAu1aLOV (protomer A).

Figure 4—figure supplement 1.

(a) Rotamer changes of Tyr266, Cys287, Met313, Leu317, Phe331, Ile333, Gln350 and Cys351 are observed in protomer A and B upon light activation. Additional rotamer changes detected in either protomer A or B are not shown, but might be also functional relevant. (b) In the dark (blue), Gln365 located on Jα forms hydrogen bonds with the carbonyl and amine group of Cys316, which are broken upon illumination (wheat) and results in undocking of Jα from the LOV β-sheet. (c) Fo-Fc omit map (green mesh) of the photoreactive Cys287 and the FMN cofactor upon light activation contoured at 2.5 σ and superimposed on the final model. The covalent Cys287-FMN adduct is significantly reduced due to radiation damage, as also observed for other LOV proteins (Fedorov et al., 2003; Zoltowski et al., 2007). (d) Overlay of 2Fo-Fc map in the dark (blue sticks and mesh) and light (wheat sticks and orange mesh). Both maps are contoured at 1.5 σ. FMN, flavin mononucleotide; LOV, light-oxygen-voltage.
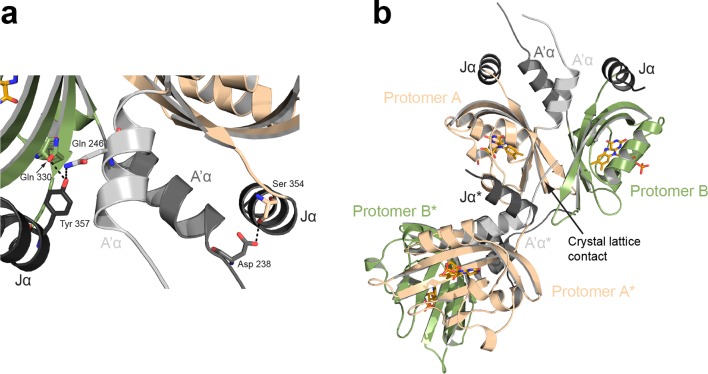
Figure 4—figure supplement 2. Interdomain interactions and crystal lattice contacts.

Figure 4—figure supplement 2.

(a) Interactions between the Jα and A'α helices observed in the PtAu1aLOV light state dimer. The two protomers are related by two-fold non-crystallographic symmetry that does not apply to the A´α helices. (b) Crystal lattice contacts observed for the PtAu1aLOV light-state dimer. The N-terminus of protomer A of a symmetry related molecule (indicated by a *) interacts with elements of the light-state dimer interface, which slightly affects the relative positioning of the two protomers. LOV, light-oxygen-voltage.
Figure 4—figure supplement 3. Effect of illumination on PtAu1aLOV.

Figure 4—figure supplement 3.

Each box reflects one peptide and contains five different colors that correspond to the differences in relative deuteration (ΔDrel) of dark and light (ΔDrel of PtAu1aLOV,light -PtAu1aLOV,dark) experiments according to the legend on the left for the incubation times of 10, 45, 180, 900 and 3600 s (bottom up). MS/MS confirmed peptides are marked with diamonds. Secondary structure elements are taken from DSSP (Kabsch and Sander, 1983) analysis of the PtAu1aLOV dark state crystal structure. DSSP, define secondary structure of proteins; LOV, light-oxygen-voltage; MS/MS, tandem mass spectrometry.
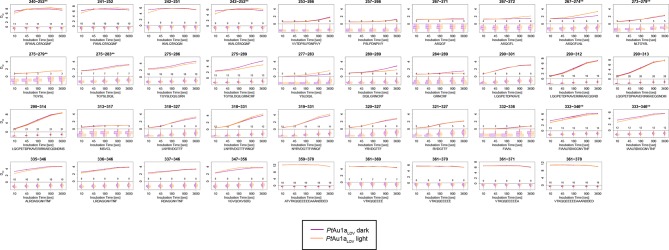
Figure 4—figure supplement 4. Overview of all 39 PtAu1aLOV peptides evaluated during HDX-MS analysis.

Figure 4—figure supplement 4.

Please zoom in on the region of interest for full details. Individual plots show the time-dependent increase in deuterium incorporation. Drel values represent the mean of three independent measurements and error bars correspond to the standard deviation. A software-estimated abundance distribution of deuterated species is presented in the lower sub-panel on a scale from undeuterated to all exchangeable amides deuterated.