. 2016 Jan 12;5:e11860. doi: 10.7554/eLife.11860

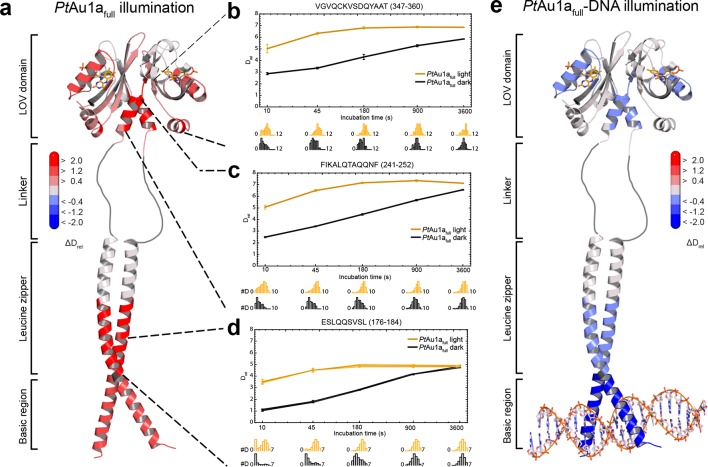
Figure 5. HDX-MS data of PtAu1afull in the absence and presence of DNA.

(a) Changes in deuterium incorporation of PtAu1afull mapped onto the structure of the PtAu1aLOV light state dimer and a model of the bZIP domain. (b–d) Deuterium uptake plots of Jα-Iβ, A'α and leucine zipper peptides with Drel plotted against the labeling time for three independent experiments. The estimated abundance distribution of individual deuterated species is shown at the bottom. (e) Differences in deuterium incorporation of PtAu1afull in the dark and light state in the presence of DNA mapped onto the PtAu1aLOV light state dimer and a model of the bZIP domain. All evaluated peptides for PtAu1afull in the absence and presence of DNA and their individual deuteration plots are shown in Figure 5—figure supplement 6 and Figure 5—figure supplement 7, respectively. HDX-MS, hydrogen/deuterium-exchange coupled to mass spectrometry; LOV, light-oxygen-voltage.

DOI: http://dx.doi.org/10.7554/eLife.11860.016

Figure 5.

Figure 5—figure supplement 1. Effect of illumination on PtAu1afull in the absence of DNA.

Figure 5—figure supplement 1.

Each box reflects one peptide and contains five different colors that correspond to the differences in relative deuteration (ΔDrel) between light and dark (ΔDrel of PtAu1afull,light - PtAu1afull,dark) experiments according to the legend on the left for the incubation times of 10, 45, 180, 900 and 3600 s (bottom up). MS/MS confirmed peptides are marked with diamonds. Secondary structure elements are taken from DSSP (Kabsch and Sander, 1983) analysis of the PtAu1aLOV dark state crystal structure and PSIPRED (Psi-blast based) secondary structure prediction (Jones, 1999). DSSP, define secondary structure of proteins; MS/MS, tandem mass spectrometry.
Figure 5—figure supplement 2. Comparison of HDX characteristics of LOV domain peptides of PtAu1afull and PtAu1aLOV in the light.

Figure 5—figure supplement 2.

Each box reflects one peptide and contains five different colors that correspond to the differences in relative deuteration (ΔDrel) of light (ΔDrel of PtAu1afull,light - PtAu1aLOV,light) experiments according to the legend on the left for the incubation times of 10, 45, 180, 900 and 3600 s (bottom up). The deuterium exchange rates of LOV domain peptides of PtAu1aLOV and PtAu1afull in the light are nearly identical, confirming that the pronounced differences in deuterium exchange rates of LOV domain peptides of PtAu1afull in the dark and light (Figure 5—figure supplement 1) originate from an interaction of the LOV and bZIP domains in the dark. HDX, hydrogen/deuterium-exchange; LOV, light-oxygen-voltage.
Figure 5—figure supplement 3. Normalized relative deuterium incorporation (Dnorm) of PtAu1afull in the dark.

Figure 5—figure supplement 3.

Each box reflects one peptide and contains five different colors that indicate deuterium incorporation after 10, 45, 180, 900 and 3600 s from HDX-MS measurements performed in the dark, normalized to the number of exchangeable amides in each peptide. Data were not corrected for back-exchange. The back-exchange rates for individual peptides under the chosen experimental conditions are in the range of ~30-–35%. Blue colors indicate low deuterium incorporation and reflect stable secondary structure elements, while red colors indicate high deuterium incorporation and flexible elements. Most of the peptides within the N-terminal domain and the bZIP–LOV linker region reach their highest deuteration level already after 10 s of labeling, indicating a significant fraction of highly dynamic or unstructured elements within these regions. MS/MS confirmed peptides are marked with diamonds. Secondary structure elements are taken from DSSP (Kabsch and Sander,, 1983) analysis of the PtAu1aLOV dark state crystal structure and PSIPRED secondary structure prediction (Jones, 1999). DSSP, define secondary structure of proteins; HDX-MS, hydrogen/deuterium-exchange coupled to mass spectrometry; MS/MS, tandem mass spectrometry.
Figure 5—figure supplement 4. Effect of illumination on PtAu1afull in the presence of DNA.

Figure 5—figure supplement 4.

Each box reflects one peptide and contains five different colors that correspond to the differences in relative deuteration (ΔDrel) between light and dark (ΔDrel of PtAu1afull,light-DNA - PtAu1afull,dark-DNA) experiments according to the legend on the left for the incubation times of 10, 45, 180, 900 and 3600 s (bottom up).
Figure 5—figure supplement 5. Effect of DNA on LOV domain peptides of PtAu1afull in the dark.

Figure 5—figure supplement 5.

Each box reflects one peptide and contains five different colors that correspond to the differences in relative deuteration (ΔDrel) between dark (ΔDrel of PtAu1afull,dark-DNA - PtAu1afull,dark) experiments according to the legend on the left for the incubation times of 10, 45, 180, 900 and 3600 s (bottom up). DNA binding of PtAu1afull in the dark induces similar effects within the LOV domain as illumination (cf. Figure 5—figure supplement 1), which suggests DNA-induced bZIP–LOV dissociation. The subtle differences in deuterium incorporation of Jα peptides observed after 3600 s in both comparisons most likely originate from slight differences in the experimental conditions of the HDX-MS measurements and have no functional implications. MS/MS confirmed peptides are marked with diamonds. Secondary structure elements are taken from DSSP (Kabsch and Sander, 1983) analysis of the PtAu1aLOV dark state crystal structure. DSSP, define secondary structure of proteins; HDX-MS, hydrogen/deuterium-exchange coupled to mass spectrometry; MS/MS, tandem mass spectrometry.
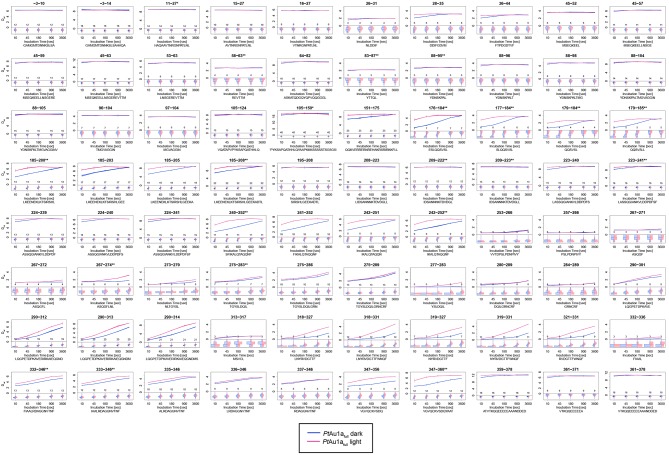
Figure 5—figure supplement 6. Overview of all 80 PtAu1afull peptides evaluated during HDX-MS analysis.

Figure 5—figure supplement 6.

Please zoom in on the region of interest for full details. Individual plots show the time-dependent increase in deuterium incorporation. Drel values represent the mean of three independent measurements and error bars correspond to the standard deviation. A software-estimated abundance distribution of deuterated species is presented in the lower sub-panel on a scale from undeuterated to all exchangeable amides deuterated.
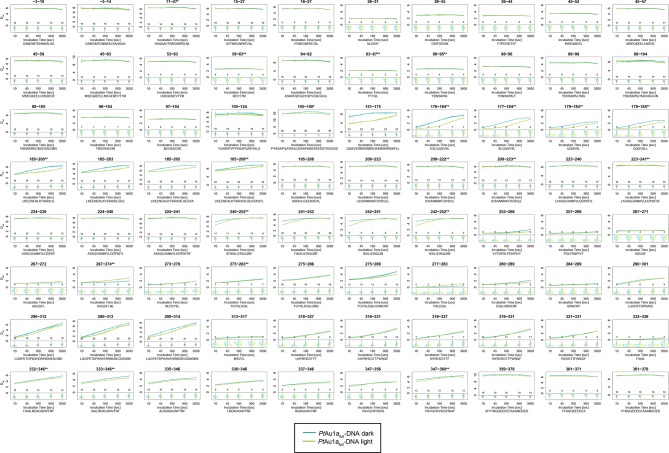
Figure 5—figure supplement 7. Overview of all 80 peptides evaluated during HDX-MS analysis of PtAu1afull in the presence of DNA.

Figure 5—figure supplement 7.

Please zoom in on the region of interest for full details. Individual plots show the time-dependent increase in deuterium incorporation. Drel values represent the mean of three independent measurements and error bars correspond to the standard deviation. A software-estimated abundance distribution of deuterated species is presented in the lower sub-panel on a scale from undeuterated to all exchangeable amides deuterated.