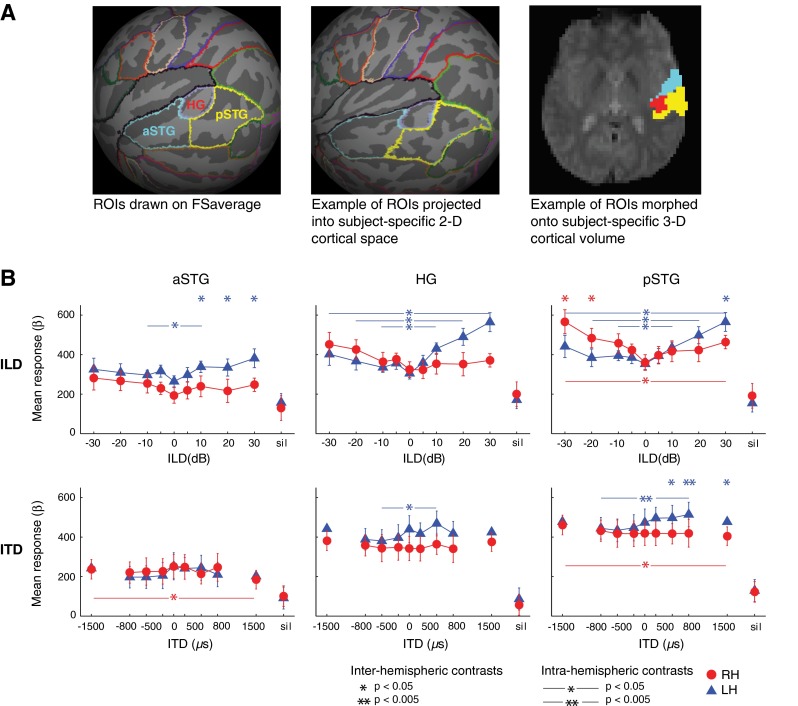
FIG. 2.

Definition and analyses of cortical regions of interest (ROIs). A Anterior superior temporal gyrus (aSTG), Heschl’s gyrus (HG), and posterior superior temporal gyrus (pSTG) ROIs drawn onto Freesurfer’s population-based 2-D surface atlas, FSaverage (left), morphed into subject-specific 2-D space (middle), and onto the subject-specific 3-D volume (right). Example subject depicted in middle and right panels. B Group response-ILD (top) and response-ITD (bottom) functions plotted in aSTG, HG, and pSTG, with significant differences in response contrasts indicated by ∗p < 0.05 and ∗∗p < 0.005. Stars above graph indicate significant differences between LH versus RH responses to stimulation at a given binaural cue level (“inter-hemispheric contrasts”). Horizontal starred lines indicate significant differences in a given hemisphere’s response to matched leftward (negative cue values) versus rightward (positive cue values) stimulation (“intra-hemispheric contrasts”). Error bars represent standard error of the mean across subjects. Blue triangles = LH responses; red circles = RH responses.
