
FIG. 3.
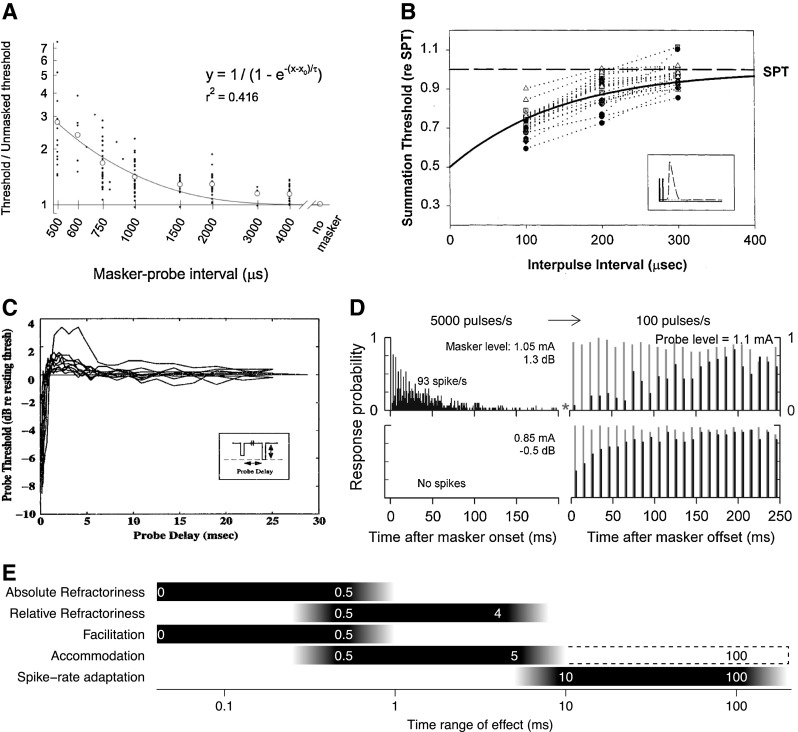
Published data from cat SGN recordings illustrating the four stimulus-response phenomena: A refractoriness, B facilitation, C accommodation, and D spike rate adaptation, and E a summary of the timescale ranges of their operation. Data in panels A–C were collected with monophasic pulses, while the data in panel D were in response to biphasic pulses. Data in panels A–C were obtained with masker-probe pairs of pulses at a range of intervals, and the responses were characterized by the ratio of the threshold current for the second (probe) pulse to the single-pulse threshold (SPT; also referred to as the unmasked or resting threshold). A To determine the absolute and relative refractory behavior, only cases when the masker pulse elicits a spike are considered. Elevated probe pulse thresholds due to refractoriness are shown for multiple SGNs (solid dots) and their average (open circles) is fitted by the function (black line) with the equation given. B Reduced probe pulse thresholds due to facilitation are observed in the range of 100 to 300 μs. Data are shown for multiple SGNs and their average is fitted by an exponential function. C Both facilitation and accommodation were observed by using a masker-probe stimulation protocol including longer interpulse intervals. The masker pulse is set to levels of 2 to 0.5 dB below the single-pulse threshold, while the level of the delayed probe is varied. Accommodation is seen at probe threshold values greater than 0 dB, whereas facilitation occurs below 0 dB. D Responses to a masker train (left panels, stimulating at a rate of 5000 pulses/s) and following responses to a probe train (right panels, stimulating at 100 pulses/s) displayed using normalized post-stimulus time histograms. Probe responses (shown in the right panels) are displayed as black bars if preconditioned with a masker train; otherwise, they are displayed as gray bars. In the top-left panel, the masker train is delivered with a constant pulse current level, substantially above the SPT, whereas in the bottom-left panel, the masker train is delivered with a subthreshold current level. In all conditions, probe trains are set to a constant current level, close to threshold. Reduced excitability to the start of the probe train is observed for both the suprathreshold masker (top-right panel) and the subthreshold masker (bottom-right panel) compared to the cases with no masker train. The bottom-left panel case is indicative of accommodation while the top-left panel case may include the combined effects of spike rate adaptation and accommodation. E The time ranges that refractoriness, facilitation, accommodation, and spike rate adaption operate at are shown as black bars. The black-to-white gradients indicate the variability in the time ranges. The white bar outlined by a dashed black line represents the time range of accumulated accommodation in response to pulse train stimulation shown in panel D. Panel A reprinted with kind permission of Springer Science & Business Media: Fig. 7 from Miller et al. (2001), © 2001. Panel B reprinted with kind permission of Elsevier: Fig. 5 from Cartee et al. (2000), © 2000. Panel C is used with permission from Fig. 3-2 of Dynes (1996). © Massachusetts Institute of Technology. Panel D adapted with kind permission of Springer Science & Business Media: Fig. 1 from (Miller et al. 2011), © 2011.