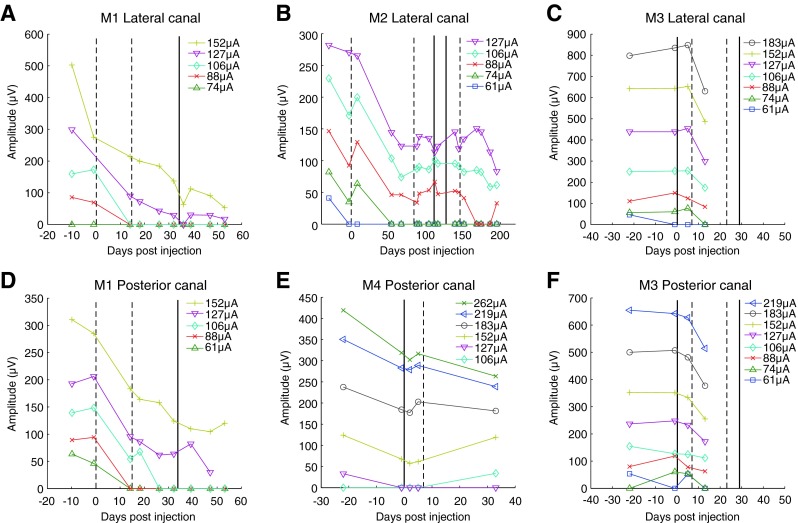
FIG. 3.

Longitudinal plot of vestibular evoked compound action potential (vECAP) N1-P1 peak amplitude at different stimulation currents for all animals. vECAPs were collected from a return electrode located in the same canal as the stimulating electrode (A, B) or from a return electrode located in an adjacent canal (C, D, E, F). Vertical solid and dashed lines denote dates for gentamicin perfusions in the ipsilateral (dashed line) or contralateral (solid line) ear.
