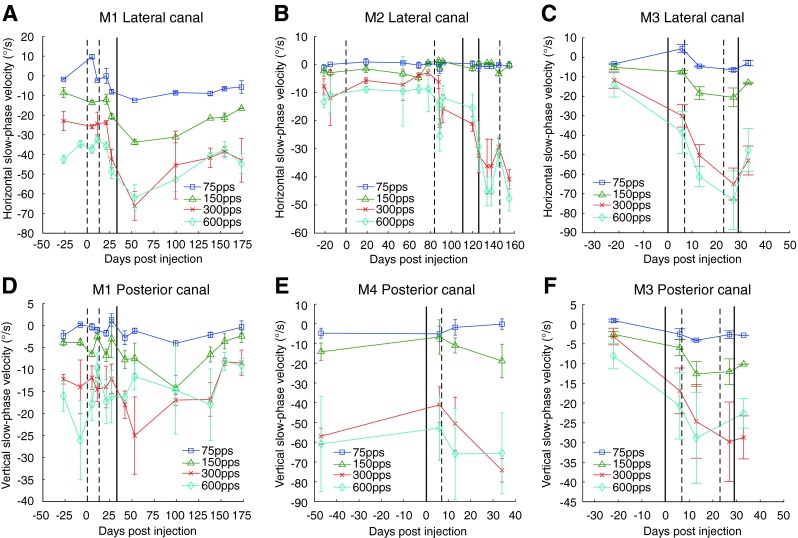
FIG. 4.

Longitudinal plot of mean slow phase velocity of electrically evoked nystagmus during 2-s trains of stimulation delivered to the lateral (A, B, C) or posterior canal (D, E, F) at different stimulation pulse rates in all animals. Velocities are from mid-range stimulation currents for each canal: either 100 μA (A, B, C, D, F) or 200 μA (E). Negative values indicate leftward or downward velocities for lateral canal or posterior canal stimulation, respectively. Vertical solid and dashed lines denote dates for gentamicin perfusions in the ipsilateral (dashed line) or contralateral (solid line) ear. Error bars are ±1 standard deviation for all slow phases recorded on that test date.
