Fig. 1.

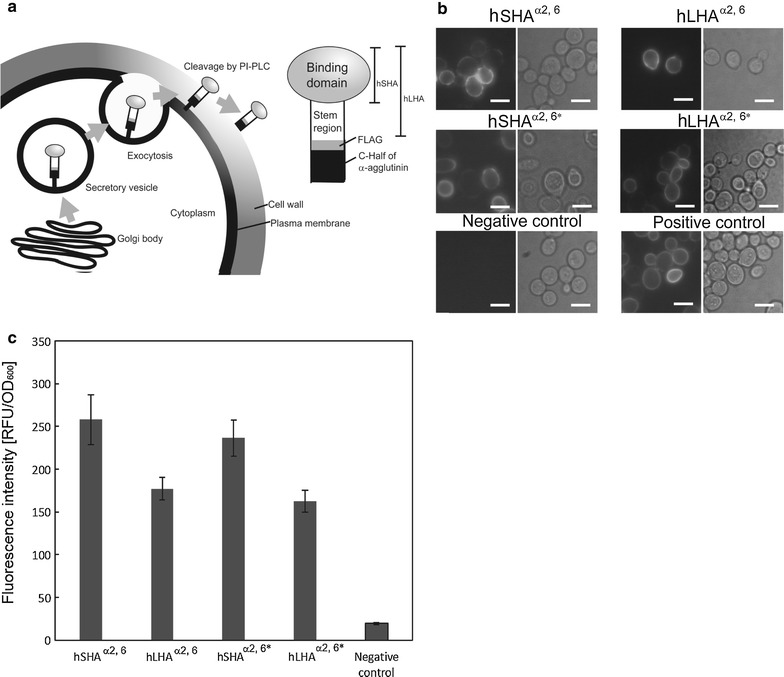
Display of HAs on yeast cell surfaces. a Scheme of yeast cell surface display of hHAsα2,6 and hHAsα2,6*. PI-PLC indicates phosphatidylinositol-specific phospholipase C. hHAsα2,6* (hSHAα2,6* and hLHAα2,6*) represent the hHAsα2,6 with two point mutations (N190E and D225G). b Immunofluorescence staining of the engineered yeast cells. Scale bars: 5 μm. c Comparison of the display efficiencies as relative fluorescence intensities following the immunofluorescence staining. Values represent mean ± standard error of the mean (SEM) based on three independent experiments
