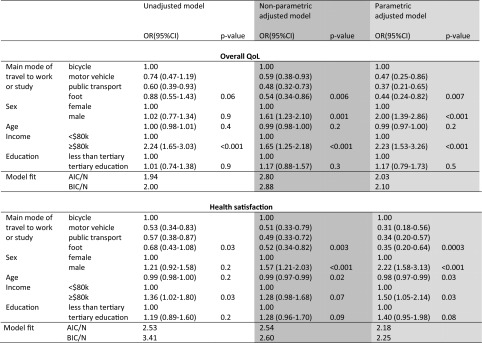
Table 4.
Ordinal logistic regression analysis of the association between QoL variables and commuting travel comparison between models unadjusted and adjusted for scale bias (n = 791)
Unadjusted and adjusted QoL modelled on cumulative proportional odds over the lower response categories. Excludes no mode of travel to work/study (n = 35)
Responses not confirming to vignette assumptions (n = 12) and missing socio-economic data (n = 8) are also excluded. Model fit information criteria are weighted to the sample dataset for comparison

