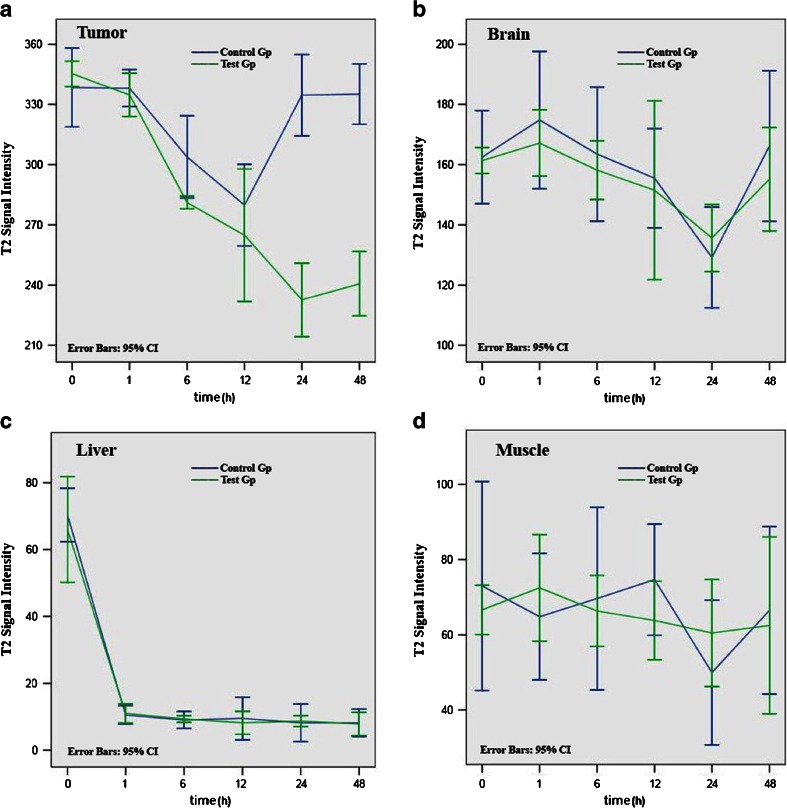
Fig. 5.
T2 signal intensity in the a tumor, b brain, c liver, and d muscle (mean ± standard error of the mean) after injection of γ-Fe2O3@DMSA NPs (blue line control group) and γ-Fe2O3@DMSA-DG NPs (green line test group). In the tumor, the predominant T2 signal intensity decreased at 24 and 48 h in the γ-Fe2O3@DMSA-DG NPs group, which was significantly different to the γ-Fe2O3@DMSA NPs group. There were no significant differences between the two groups with regard to the brain, liver, and muscle.

