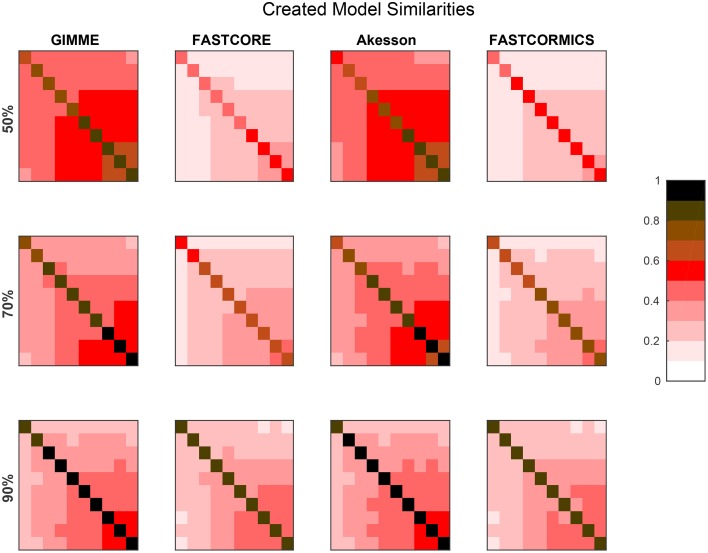
Figure 3.
Resolution power: The plot shows Jaccard distances for the networks generated by the algorithms, when trying to create the artificial networks. For each of the ten artificial models 100 runs were performed and each square represents the mean Jaccard distance between these networks. E.g., For each percentage and algorithm, the tenth square in the first row is the mean of all pairwise Jaccard distances between the 100 models generated for artificial model 1 (the smallest) and the 100 models generated for artificial model 10 (the largest) generated for the respective algorithm and percentage. The diagonal is the mean of the pairwise Jaccard distances between 100 runs performed. The diagonal can therefore be an indicator for robustness (the brighter, the more similar the models) while the off diagonal indicates similarities between the generated models and is therefore an indicator for specificity to the input (the darker, the more distinct the generated models). When 90% of the data is available, all the algorithms are able to distinguish variations between the different models. But with a less complete data set, inclusive algorithms (here GIMME and Akesson) lose in specificity. It would also be expected that when only 50% of the data is available, the robustness decreases.

