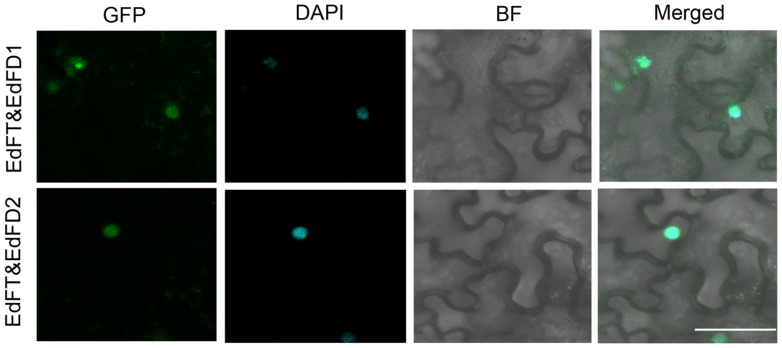
FIGURE 5.
Bimolecular fluorescence complementation (BiFC) analysis shows the protein interaction between EdFT and EdFDs. EdFT&EdFD1, coexpression of 35S:EdFT-cYFP and 35S:nYFP-EdFD1; EdFT&EdFD2, coexpression of 35S:EdFT-cYFP and 35S:nYFP-EdFD2. GFP, GFP fluorescence; DAPI, fluorescence of 4, 6-diamino-2-phenylindol; BF, bright-field; Merged, merged image of GFP, DAPI, and BF. Bar represents 50 μm.

