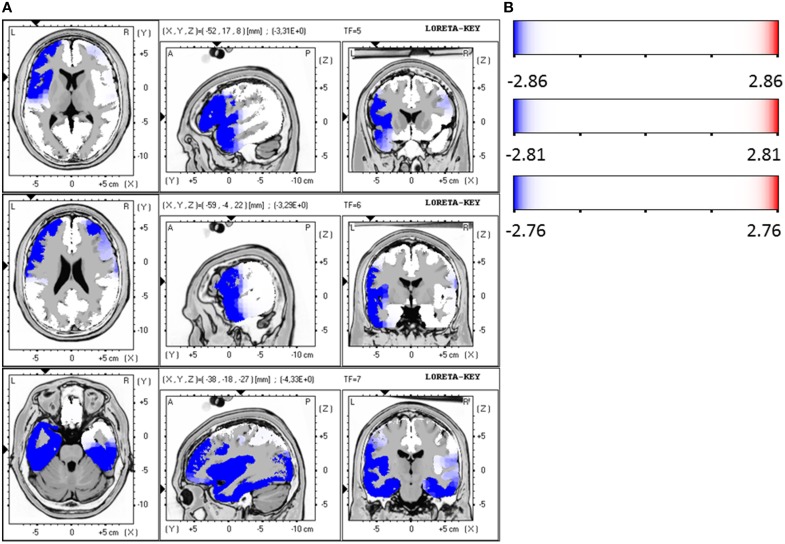
Figure 4.
(A) LORETA images for responders vs. non-responders at baseline: Images on top show voxel-wise current density differences in the frequency band beta 1 at baseline. The middle line contains the frequency band beta 2, in the bottom line the same is shown for the frequency band beta 3. Blue areas represent brain regions showing significantly lower LORETA values at baseline. The blue color indicates a statistical significant effect (images in the top line: tmax = −3.31, xyz = −52, 17, 8 p < 0.05; middle line: tmax = −3.29, xyz = −59, −4, 22 and bottom line: tmax = −4.33, xyz = −38, −18, −27) of reduced current density in the MNI-MRI-standard space. (B) Corresponding color bar.

