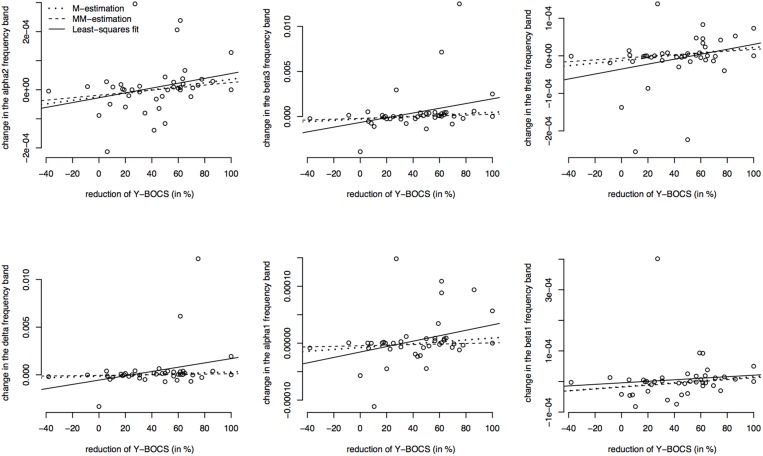
Figure 5.
Correlations between the psychopathology [reductions of Y-BOCS scores (%)] and the change in frequency bands (time point 10 weeks minus baseline) in the OFC. Frequency band alpha 2, beta3, theta, delta, alpha 1, and beta 1 are shown (in μAmpere/mm2) and regression lines obtained through M-estimation, MM-estimation and the least squares method.

